Login with email
Login
Login with your email or your MT4 credentials.

When it comes to using RSI (Relative Strength Index) to trade, a common method for this technical indicator you’ll often see in forums is to buy when RSI goes into oversold territory (below 30) and sell when it goes into overbought territory (above 70). Some variations of the strategy involve waiting for the RSI line to cross back above 30 (to buy) and to cross below 70 (to sell).
However, in this article, we’ll be exploring an approach I’ve learned through many years of institutional research. The basis of the strategy is to question why we would use the 30/70 values to trade – whoever said those were the correct values to use. Strictly speaking, the 30/70 value is more of a guiding principle vs. a blueprint.
In the picture below, we can see that the past 3 bounces occurred when RSI was not at 30%, but instead at 19.74%

What we can see from this is that the RSI value where bounces occur, in this market, happens to be at the 19.74% level. This is not at the 30% level which most strategies would focus on.
With that in mind, we can look for potential bounces by focusing on what I would term the “True RSI” level of the market. The important thing to note here is that the True RSI differs from market to market, symbol to symbol, and even time frame to time frame. So, in the above example (GBP/JPY, H1), at this point in time, the True RSI is 19.74%. If a trader can identify this, they can forecast with a higher possibility where the next potential bounce might occur.
My rule of thumb is to minimally have an 80% confidence level. That means, over the past 5 occurrences where price bounced, 4 of them need to have coincided within 5% of each other on the RSI (since 4 out of 5 is 80%). With an 80% confidence level, you have a decent chance that at the 6th time, RSI touches the True RSI level, that price would bounce. Let’s see an example of this in action.

In the example above, we can see that in the past 5 occurrences, the price dropped nicely each time RSI reached the 63% area. Based on this observation, we can forecast that the next time the RSI reaches the 63% area, we could see a corresponding reversal in price.

Extending the chart, we can see that RSI has reversed nicely off the 63% level, and, in line with that, the price has also reversed nicely.
To further improve your knowledge of the RSI strategy, analyse the different methods in our trading strategy webinar. Find additional trading opportunities and improve your accuracy with them, including:
I tend to rotate around using the 21, 34, 55, and 89 settings for the RSI and don’t stick to just using RSI 14. The trick is to find the RSI setting that best suits the market. No one has ever said that RSI 14 is the correct setting – in fact, it’s just the default setting.
It’s important to open your mind up to the possibility that the default settings are not always the correct settings. Instead, it’s up to us to find the True RSI settings of the market.
I try to have a minimum sample size of 5. This means that we need a minimum of 4 out of 5 of the past reversals in price to coincide with a 5% range in RSI.
You could try 8 out of 10, but those conditions can be a bit too strict and might reduce the number of times you can find such setups.
This approach tends to work best on the H1, H4, and D1 charts. On the smaller time frames, there tends to be too much noise so the forecasts are less accurate.
It’s not easy scanning multiple RSI settings across multiple time frames trying to find setups that meet the 80% confidence criteria. Thankfully, there’s an indicator for this called the MT4 True RSI Indicator.
The indicator allows you to:
You’ll end up with results like these:
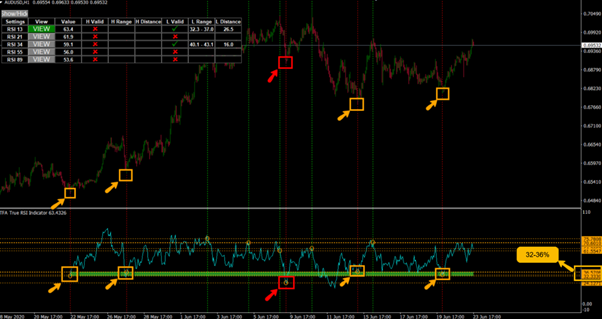
In the above example, we can see that out of 5 of the price reversals, 4 of them (boxed in yellow) bounced nicely off the 32-36% level on RSI.

The True RSI Indicator allows you to scan and find hidden support levels. The above picture explains how to read the table, easily discovering True (hidden) RSI Areas. Here is an explanation of the various settings:
This is the various RSI settings we are testing (up to 5 at a time)
Clicking on this will load the RSI along with the hidden area. We usually click “View” only if there is a valid hidden RSI area.
High valid meaning there is a hidden RSI swing high resistance area (when we’re playing drops instead of bounces).
Shows the hidden RSI area range for this hidden RSI swing high resistance.
Shows the distance of the current RSI to the hidden area. The lower the number means the closer it is.
Low valid meaning there is a hidden RSI swing low support area (where we play bounces from).
Shows the hidden RSI area range where the hidden RSI swing low support is.
Shows the distance of the current RSI to the hidden area. The lower the number means the closer it is.

In the same way, the True RSI Indicator can find hidden support levels, it can also identify hidden resistance levels. In the above example, we can see how the True RSI indicator identifies the hidden resistance area of 58-61% where the past 4 out of 5 reversals occurred nicely.
The True RSI Indicator is very flexible, allowing you to adjust the sensitivity of many inputs so you can fine-tune your strategy.

Here’s a brief explanation of the settings:
ATR Period, ATR Multiplier, Swing Sensitivity
These three go hand-in-hand to define how large your swing lows and swing highs are on the price chart. We need these because we want to create beautiful swing lows and swing highs.
Here’s an example of how this works:
ATR Period = 14 (assuming current ATR value is 10 pips)
ATR Multiplier = 5 (so 10 x 5 = 50 pips)
Swing Sensitivity = 30 bars
This means that you’ll need a swing high/low of at least 50 pips within 30 bars to be considered a valid swing high/low for the indicator.

Swing Number:
This is the number of swing highs/lows you will consider. We don’t want too many as it can get quite messy – I usually stick to 5 as the sweet spot. That means we’ll look for the past 5 major swing highs and past 5 major swing lows.

RSI Period (1,2,3,4,5):
These are basically the RSI period settings you want to test. I personally find the 13, 21, 34, 55, and 89 numbers the best.
RSI Sensitivity:
This measures the sensitivity of the “hidden area”. If you have a sensitivity of 5, that means it scans within a 5% area (e.g. 10% to 15%). The smaller this number, the more accurate the area has to be. I don’t recommend it being too small though; 5% seems to be the sweet spot, 10% will find large areas and that would not be as useful.
RSI Confidence Level:
Remember the “SwingNumber” I mentioned above? This is basically the percentage of swing highs/lows that need to fall within our hidden area (as defined by RSI Sensitivity) above. So, if our swing number is 5 and our RSI Confidence Level is 80%, that means 80% of the most recent 5 swing highs/lows need to coincide exactly within a 5% area (assuming our RSI Sensitivity is 5%). So this means 4 out of 5 most recent swing highs/lows is the minimum requirement.
Ready to trade your edge?
Join thousands of traders and trade CFDs on forex, shares, indices, commodities, and cryptocurrencies!
This information is not to be construed as a recommendation; or an offer to buy or sell; or the solicitation of an offer to buy or sell any security, financial product, or instrument; or to participate in any trading strategy. It has been prepared without taking your objectives, financial situation, or needs into account. Any references to past performance and forecasts are not reliable indicators of future results. Axi makes no representation and assumes no liability regarding the accuracy and completeness of the content in this publication. Readers should seek their own advice.