
Login with email
Login
Login with your email or your MT4 credentials.
The engulfing candlestick pattern is a popular and easily recognised candlestick pattern, used by traders worldwide. It consists of two candles, with the main one – as the name suggests – engulfing the body of the previous candle. There are two variants, a bullish and a bearish one, and depending on its location on the chart, it can signal a potential trend reversal. The pattern appears on all timeframes and charts of all trading instruments and can be used both for short-term and long-term trading.
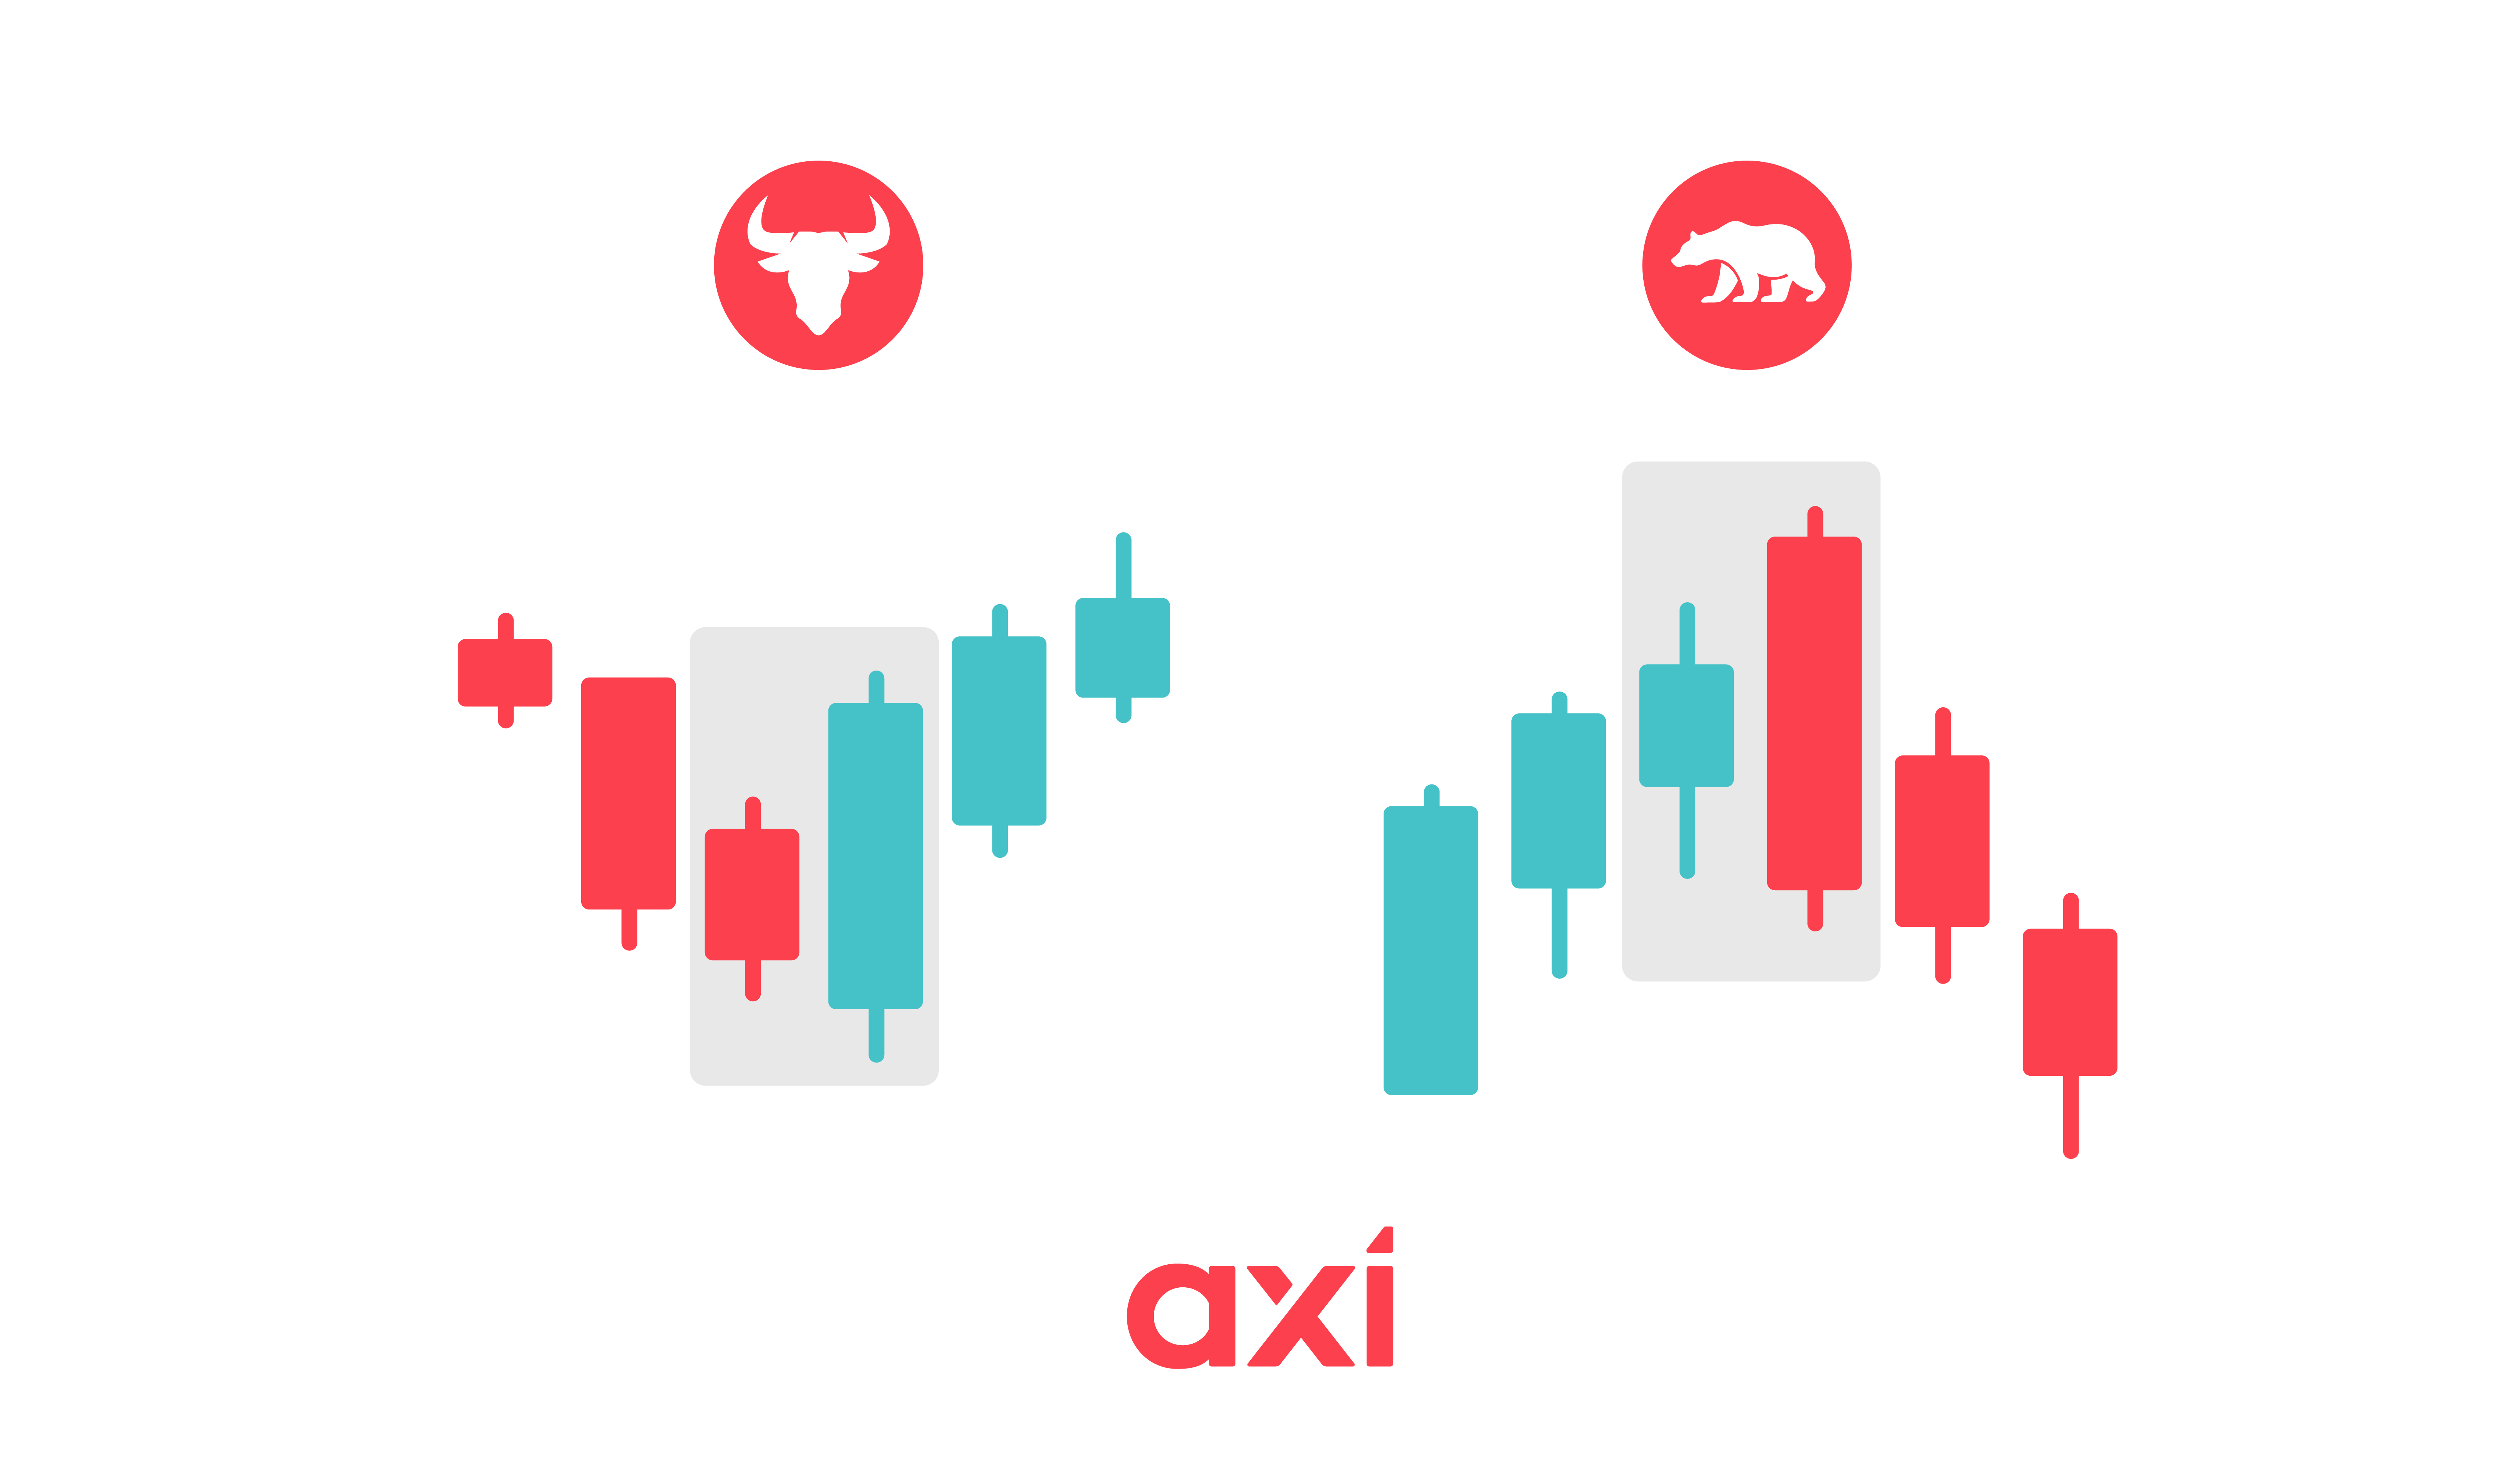
The bullish engulfing candle forms at the end of a downtrend. The first candle in the pattern must be a small, bearish candle, while the second one must be a large bullish candle that engulfs the body of the first candle.
The bearish engulfing candle appears at the end of an uptrend. The first candle is a small, bullish candle, which is followed by a large bearish candle that engulfs the body of the first one.
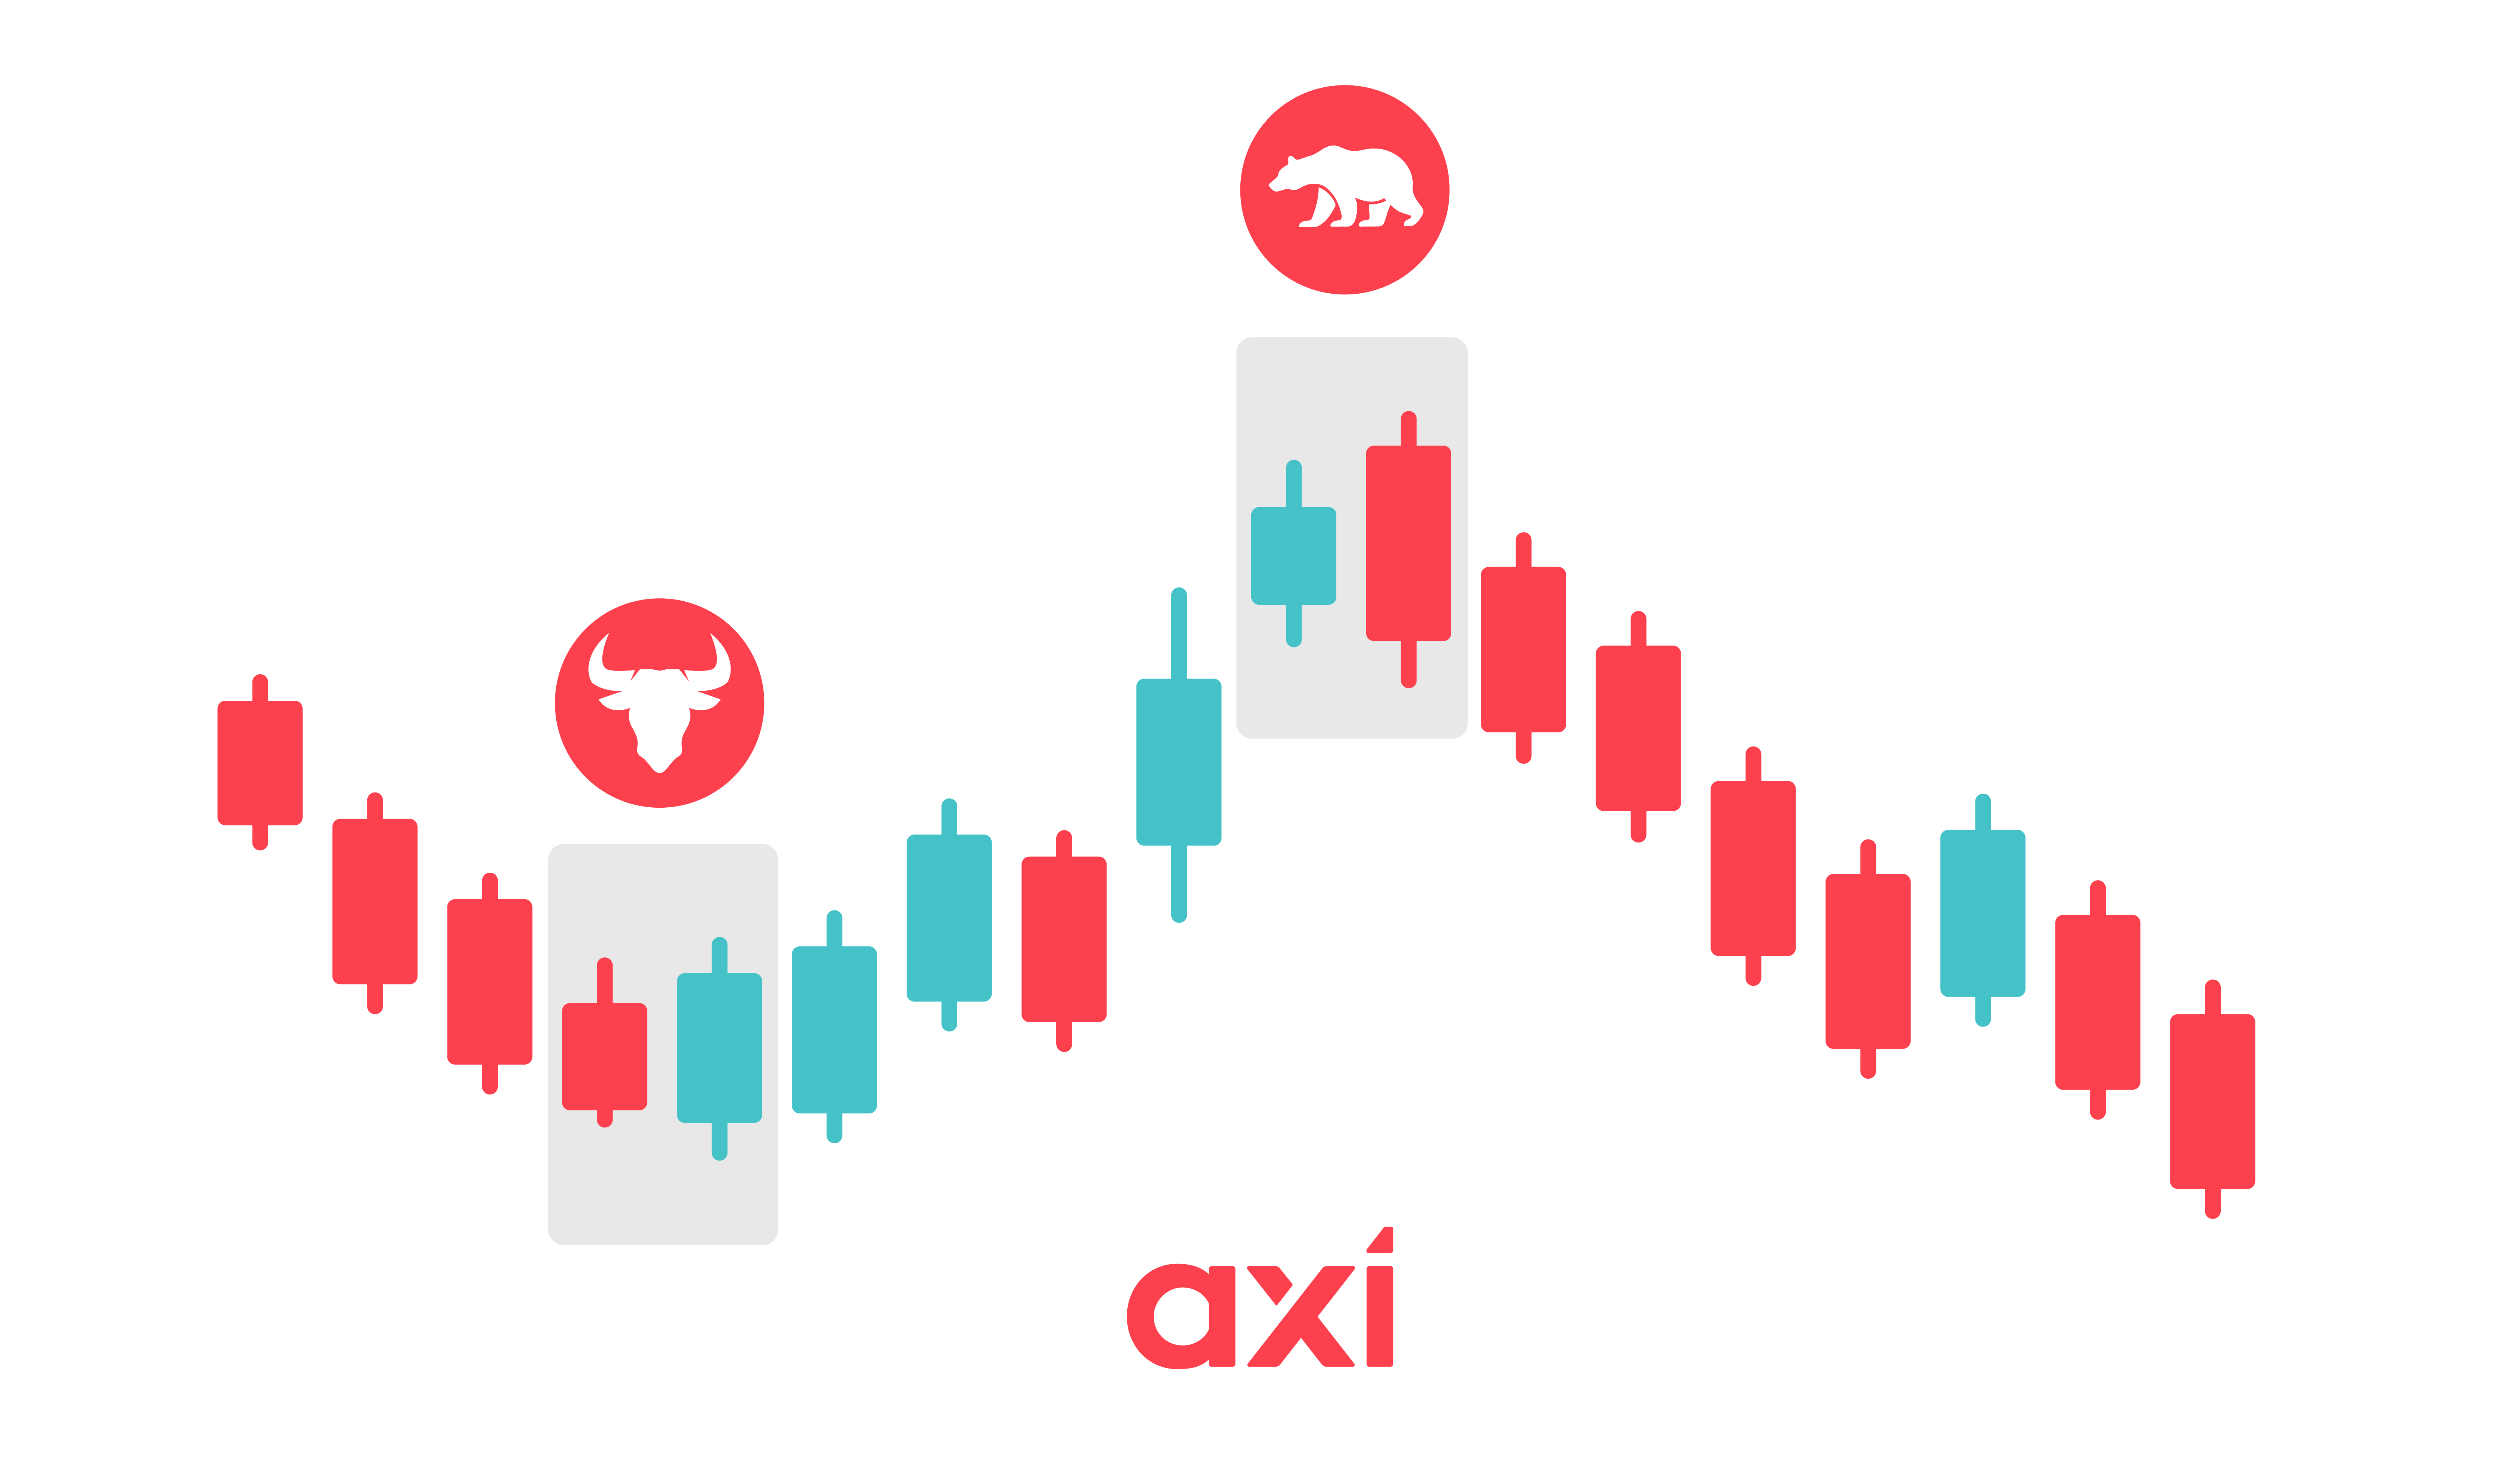
Engulfing candlestick patterns can appear anywhere on the chart, but it is important to observe the current market environment. The pattern is only relevant when there is an existing trend, as there would be many false signals during a market consolidation.
The pattern consists of two candles. The first candle tells us that the trend is still prevailing but given the size of the candle (small body), there is no significant momentum. The second candle is large in size and indicates significant momentum in the opposite side, indicating that buyers (in the case of a bearish engulfing) or sellers (in the case of a bullish engulfing) have lost control and that a trend reversal could follow.
It is crucial that the second candle's body fully engulfs the first candle, as the pattern is not valid otherwise.
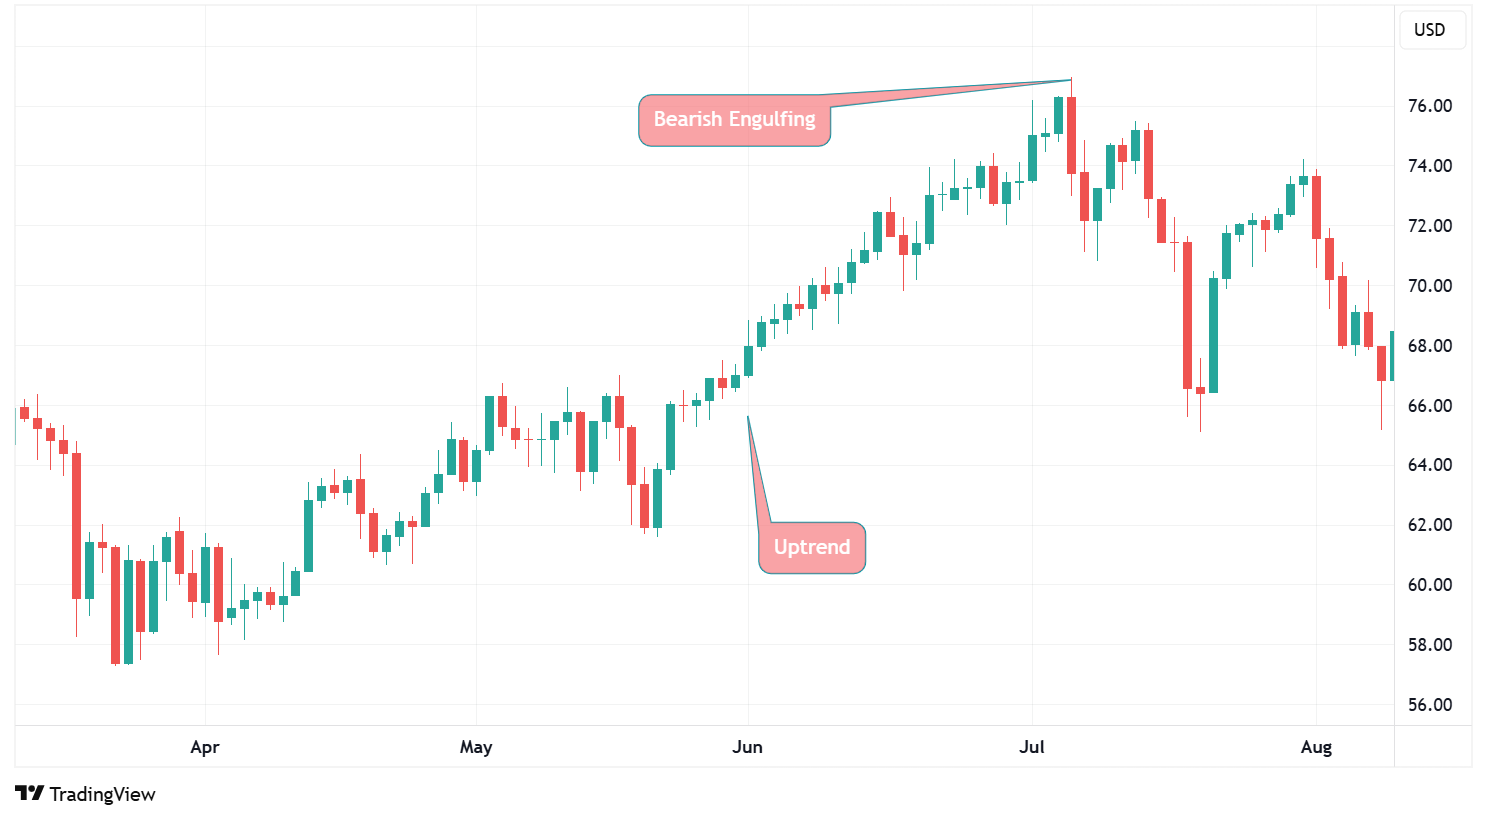
Oil is in an uptrend. Prior to the engulfing candlestick, there is a smaller bullish candle that would initially indicate bulls are still in control. However, oil hit strong resistance and a rapid sell-off follows, forming the engulfing candle. The third candle closes below the body of the engulfing candle, suggesting strong downside momentum.
When we spot an engulfing pattern, it is crucial to establish that there is a prevailing trend. For bullish engulfing patterns, this would be a downtrend. For bearish engulfing patterns, this would be an uptrend.
For the entry, it is crucial to wait for the close of the second candle and to ensure it fully engulfs the body of the previous candle. There are generally two approaches:
Traders looking for an aggressive entry may enter the position as soon as the engulfing candle closes, i.e., at the open of the next candle. Traders who prefer a cautious approach may wait until the third candle - the one that follows the engulfing candle - breaks above the high of the engulfing candle.
The stop loss is typically placed below the low or above the high of the engulfing candle. There is no specific rule where the take-profit is set, so traders usually rely on classic support/resistance levels or Fibonacci retracements.
As with any candlestick pattern, engulfing patterns can be combined with other tools and indicators. For example, a bullish engulfing pattern that appears near an important support level could be seen as more significant. At the same time, indicators such as the RSI (Relative Strength Index) can indicate whether markets are overbought/oversold. A bullish engulfing pattern that appears during oversold conditions could be seen as favourable.
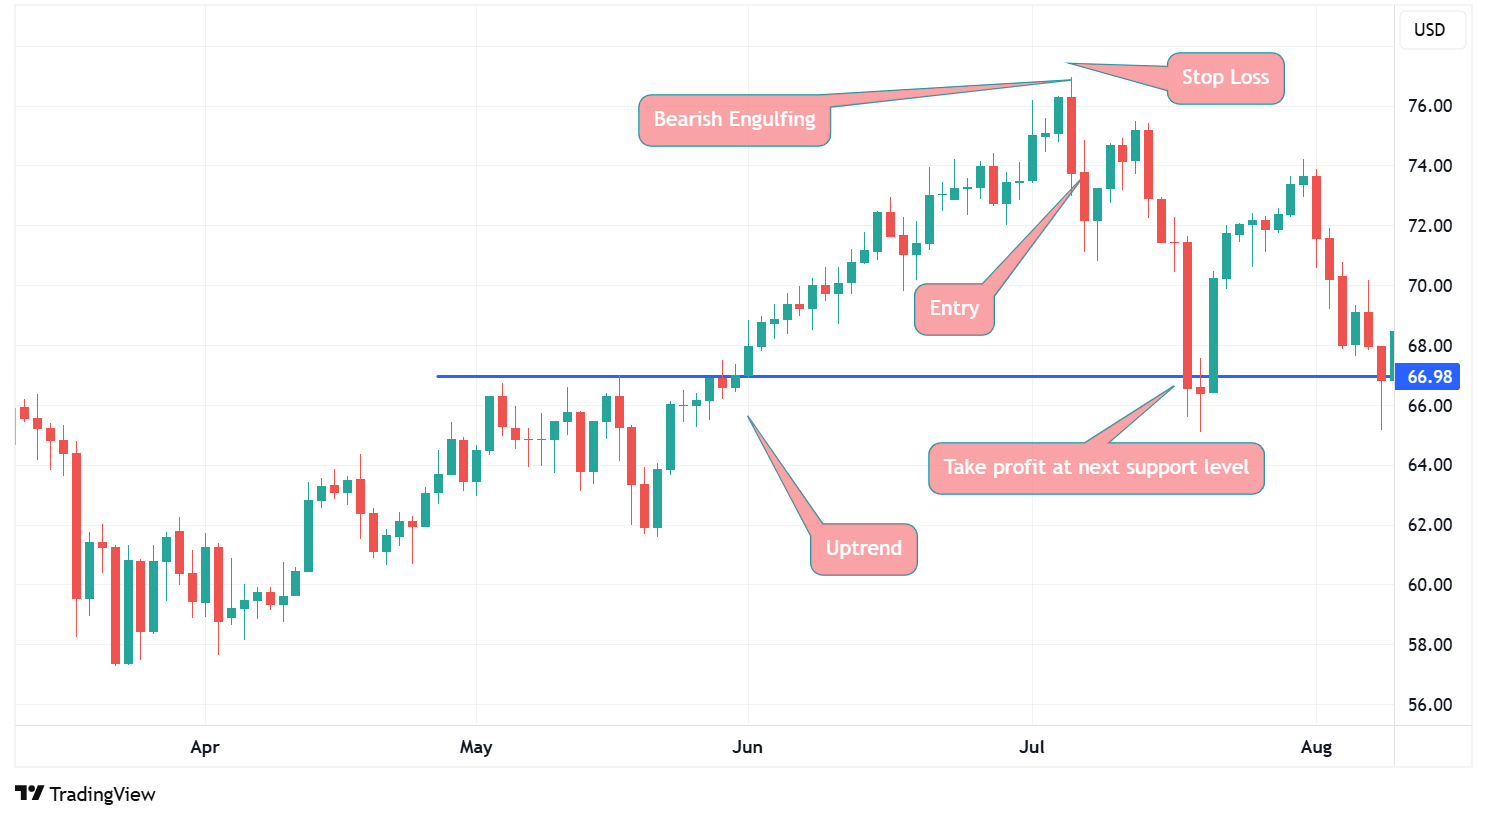
The entry happens on the open of the third candle – the one appearing after the engulfing candle. The stop-loss order is placed just above the engulfing candle, while the take-profit order is placed at the next significant support level.
The engulfing candlestick pattern has several advantages including:
That being said, the engulfing candlestick pattern also has some disadvantages, including:
The engulfing candlestick pattern is a popular candlestick pattern that indicates a potential trend reversal. It has two variants - the bullish engulfing candlestick that appears at the end of a downtrend, and the bearish engulfing candlestick that shows up at the end of an uptrend.
It consists of two candlesticks - the first candle that has a small body and moves in the direction of the prevailing trend, and the second candle that moves in the opposite direction of the prevailing trend and engulfs the entire body of the previous candle.
Ready to trade your edge?
Join thousands of traders and trade CFDs on forex, shares, indices, commodities, and cryptocurrencies!
This information is not to be construed as a recommendation; or an offer to buy or sell; or the solicitation of an offer to buy or sell any security, financial product, or instrument; or to participate in any trading strategy. It has been prepared without taking your objectives, financial situation and needs into account. Any references to past performance and forecasts are not reliable indicators of future results. Axi makes no representation and assumes no liability with regard to the accuracy and completeness of the content in this publication. Readers should seek their own advice.
FAQ
A candlestick pattern consisting of two candlesticks that signals a potential trend reversal.
Both variants exist. The bullish version appears at the end of a downtrend, while the bearish version appears at the end of an uptrend.
As with any pattern, false signals can occur, and traders should ensure that they follow the rules of the pattern and use other tools or indicators for additional confirmation.
Yes, it does. It is used both for short-term and long-term trading.
Yes, otherwise it is not a valid signal.
Stop-loss orders are usually placed above/below the engulfing candle.
The take-profit order is usually determined with the aid of classic support/resistance levels, as well as Fibonacci retracement levels.

