
Login with email

Technical analysis is a method of analysing the market, focusing on trends in prices and trading volume. It helps traders identify areas where there may be potential opportunities for profit or risk reduction, as well as warning signs to avoid.
Technical analysts will study charts and other data, looking at things such as recent price movements, high-volume areas (indicating interest from many investors), levels of support and resistance, and technical indicators (such as moving averages) to help forecast future price movements. This allows them to make informed decisions about their trading strategies.
In this guide, there are details about performing technical analysis on financial assets, the pros and cons of technical analysis, how it compares to fundamental analysis, and why it’s important to conduct technical analysis before opening new trades.
Technical analysis is a term that refers to the process of analysing the price movements, or market activity, of a currency pair in forex trading, or other financial assets like a stock or a cryptocurrency.
The key principle behind technical analysis is that the price of a financial asset reflects all the available information about the particular asset. This means that, in most cases, technical analysts do not consider any of the fundamental factors that could affect the price of a currency pair. Instead, they believe that everything a trader or investor would like to know about the asset is reflected in its price. Technical analysis can be applied to both short-term and long-term investments.
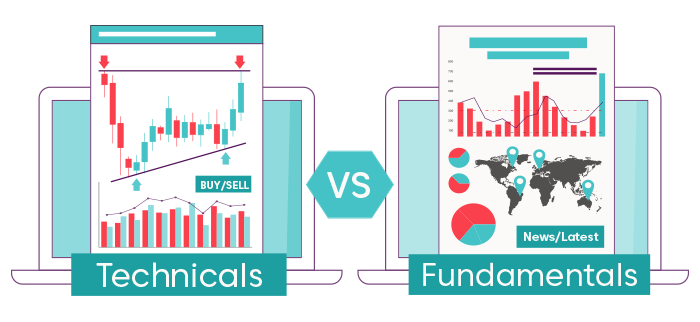
Technical analysis is used to forecast price movements by using various candlestick chart patterns and technical indicators, while fundamental analysis includes analysing various economic data, news, and central bank updates to anticipate future price movements.
Generally speaking, technical analysts tend to focus on either short-term or medium-term trading. Meanwhile, fundamental traders are typically looking at a medium to long-term time horizon.
Which form of analysis is the best? There is no correct answer to this question. Beginners might find it easier to start with technical analysis and study fundamental analysis later. While some traders will be happy to only rely on technical analysis, some find value in fundamental analysis and incorporate it into their trading strategy. Just as is the case with finding the right trading strategy - the only way to find out is by trial and error.
The first step to performing technical analysis is to understand the three main assumptions on which it is built:
This assumption is also referred to as the efficient market hypothesis, which allows traders to ignore all fundamental factors that could affect an asset. Therefore, technical analysts and traders typically focus solely on analysing the instrument's price movements.
This assumption states that despite the millions of individual price movements recorded in a day, price movements are not random as they do follow specific trends. The main objective of technical analysis is to identify the current trend and use it to predict future trends.
This assumption is based on the belief that prices in financial markets are driven by the human emotions of fear and greed. Therefore, price patterns that occurred in the past tend to be repeated if the same conditions that drive traders’ emotions exist today.
The above principles explain why some technical analysis patterns and tools have been in existence for over 100 years, yet they are still effective in today’s markets.
First of all, you need to understand your strategy and have a trading plan ready. This is important because you need to know what kind of market environment suits your strategy. Based on this, you can pick appropriate trading instruments. For example, if your strategy is based on range trading, you might want to pick a currency pair with low volatility such as EUR/CHF instead of a volatile pair like AUD/JPY.
Before moving on to the analysis part, you want to make sure your charts are "clean" - i.e. that you only have the technical indicators on the chart that are part of your strategy. You should also make sure you do not use too many indicators as this could give you conflicting signals.
Once you have performed your analysis, you want to keep track of your observations. You can do this either by writing them down or highlighting them visually (for example, highlighting an area of major resistance you think will not be breached).
The following steps will help guide you when using technical analysis as part of your trading strategy.
This is the first step in technical analysis for traders because trading strategies can either follow the trend or go against the trend. However, for each of these systems, you have to identify whether the current trend is an upward trend, a downward trend, or a sideways trend. Each of these three price trends requires a different trading approach, depending on your trading strategy. In this case, we’ll demonstrate using a trend-following trading system.
For such a system, traders generally buy or take long positions in assets that are in an uptrend. Assets in a downtrend are typically sold short, while instruments in a trading range are commonly entered into at established support or resistance levels where a trader believes there is a high likelihood of a trend reversal.
Support and resistance levels are areas where the price of an asset is likely to reverse or stage a breakout.
A support level is a level where the downward price trend of an asset pauses as buying demand increases, so the trend reverses and turns upward. The same reasoning applies to resistance levels where the upward price momentum of the asset weakens and the price is likely to reverse and head downward. Support and resistance levels can provide excellent opportunities for traders to open new trades.

While identifying areas of support and resistance can present excellent entry positions, there are other factors technical traders can consider when determining their entry positions. These include the values of technical indicators such as the Average True Range (ATR) and Relative Strength Index (RSI). These are volatility indicators, which can help a trader establish whether there’s adequate momentum behind a price move.
Technical momentum and volatility indicators such as the Average True Range are commonly used by professional traders to help with position sizing and risk management. Depending on your chosen risk/reward ratio, you can use the ATR to determine where to place your stop loss once you’ve identified an entry position.
For example, some long-term traders prefer to set their stop loss order 1ATR away from their entry position with a profit target 3ATRs away for a 1:3 risk/reward ratio.
Traders use technical analysis for the following purposes:
To get a better understanding of why technical analysis can have its ups and downs, refer to the pros and cons of using technical analysis when trading.
Pros:
Technical analysis is more suitable for beginners as the information is easier to process. Applying fundamental analysis requires a solid understanding of not only macroeconomics but other factors that can influence the markets, like geopolitics.
Technical analysis is a visual representation of emotions and market psychology and traders can gather a lot of information just by looking at a chart.
Finally, the tools needed to analyse the charts are mostly available for free. On the other hand, fundamental analysis might require access to certain tools that can be expensive.
Cons:
There are a large number of indicators available, and it is easy to get lost and suffer from information overload. Generally, it is better to stick to 1-3 technical indicators, as having too many on your chart could generate conflicting signals.
Technical analysis can be quite subjective. You can show the same chart to two traders and they could both come up with completely different interpretations.
Technical indicators are mathematical calculations – and even sometimes as simple as a trendline – that allow traders to identify when an asset might have reached its peak or has bottomed out. It uses historic price, volume, and open interest information to forecast what direction the financial market which is being analysed is going. This underlying knowledge can help a trader identify trading opportunities.
Two of the most popular indicators are:
The moving average indicator is one of the most popular technical indicators and it's used to identify trends in a market. For example, if the short-term MA crosses over the long-term MA, this is an indication that there might be an upward trend coming up in the future. Another common area where the moving average indicator is used by traders is to identify the trend reversal level.
There are many different types of moving averages, and some traders use more than one to confirm their signals. Some examples include simple moving averages, exponential (more weight given to recent numbers), or weighted (giving each day in the lookback period equal importance).

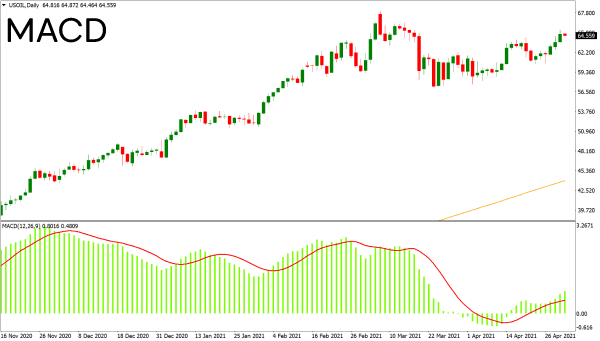
The MACD is a technical momentum oscillator that plots two exponential moving averages, one of which has been subtracted from the other to create a signal line or "divergence" (MACD Line) and then added back to it (signal).
There are three main parameters - signal length, moving average convergence/divergences frequency, and periodicity. By default, these values are 12, 26, and 20 respectively. The longer the duration on each MA gives more weighting but also decreases sensitivity because with increasing time there will be fewer periods during which change can occur.
A candlestick chart is a form of displaying all the important information a trader needs for the price. The opening, high, low, and closing prices are visible and easily recognised during a specific time frame. They are usually preferred to the traditional bar charts because, from a visual perspective, they are much easier to interpret (especially when combining multiple candlesticks together to form - candlestick patterns).
Conceptually candlesticks (through patterns) measure market sentiment in the form of bullish vs bearish strength. Each of these patterns tells us a different story about what we could expect from the price movement.
Candlestick chart analysis provides easily readable information. For example, when the close is higher than the open, you know immediately because the body is green. If this happens several days in a row, you can assume a short-term uptrend is in place. If you look at a bar chart, this information is not as easy to identify. You can also deduce more information from a candlestick chart as compared to other charts, like a line chart.
Finding the right trading strategy will require a lot of trial and error. Beginners generally start with very basic strategies and then start to add more and more indicators and rules to them as they continue to learn. However, a complex strategy doesn't guarantee success.
Here are some examples of basic strategies utilising technical analysis:
MA Crossover: A strategy where a trader would look for periods when a short-term moving average crosses above/below a longer-term moving average to define a trend.
Example: Buy when the 50 MA crosses over the 200 MA and sell when the 50 MA crosses below the 200 DMA.
Bullish/bearish Divergence: Traders using this strategy will be looking for periods when an oscillator and the price of an instrument are diverging.
Example: A price of an instrument might continue to post higher highs, while the RSI (Relative Strength Index) in the same timeframe is moving in the opposite direction. This could signal that the rally is running out of steam and traders might look for opportunities to go short.
MetaTrader 4 is one of the most popular trading platforms available, and it gives you the opportunity to access a wide variety of indicators, as well as drawing tools.
Axi clients are also able to gain access to Autochartist - a tool used for automated technical analysis that continuously scans the market for opportunities.
The MT4 NexGen package is another useful tool that can prove to be very valuable to traders - from sentiment indicators to correlation tools.
Ready to trade your edge?
Join thousands of traders and trade CFDs on forex, shares, indices, and commodities!
This information is not to be construed as a recommendation; or an offer to buy or sell; or the solicitation of an offer to buy or sell any security, financial product, or instrument; or to participate in any trading strategy. It has been prepared without taking your objectives, financial situation, or needs into account. Any references to past performance and forecasts are not reliable indicators of future results. Axi makes no representation and assumes no liability regarding the accuracy and completeness of the content in this publication. Readers should seek their own advice.
FAQ
Axi offers a range of trading education and resources that can help improve your knowledge of technical analysis. Make sure to check out the free trading courses on Axi Academy, download our helpful eBooks, and keep up to date with our educational articles.
There has always been a debate about whether technical analysis works or not. TA leaves more room for interpretation - two traders looking at the same instrument on the same timeframe may have a completely different view of where the asset will be heading.
Technical analysis does work overall, and because many traders use it, it can become a self-fulfilling prophecy. For example, a 200-moving average is a tool that many traders use or at least keep an eye on. If enough market participants believe that the price of a falling instrument will bounce off the 200 DMA and buy ahead or at that level of support, this indicator can be seen as having predictive qualities.
The same applies to traditional support/resistance levels. For example, the 1.20 level in EUR/USD is a major psychological level. A breakout to the topside could trigger further momentum buying and push the currency pair even higher.
However, such events tend to only have a short-term impact on markets. A breakout above 1.20 might have given EUR/USD a boost, but it is unlikely that the currency pair will see a significant rally only because of that. The forex market is too big, and there are too many market participants with different strategies and goals.

