
Login with email

The inverted hammer is a bullish candlestick pattern. It can be spotted during a downtrend and is hinting at a bullish reversal. As the name suggests, it appears in the form of a hammer turned upside down.
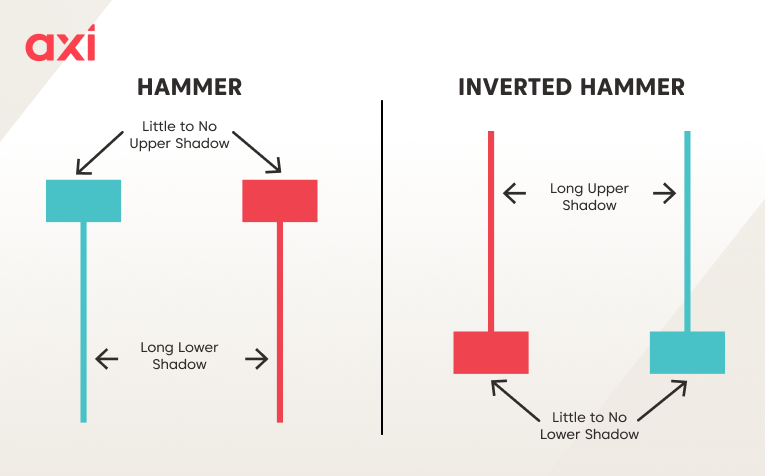
The candlestick itself has a small body, which can be either green or red, located at the lower end of the candlestick. It also has a long upper shadow and a no or an insignificant shadow. The inverted hammer is easy to recognize and is one of the most popular candlestick patterns.
The inverted hammer can be traded on its own, but most traders combine it with other tools and indicators to improve its reliability.
An inverted hammer is always a bullish reversal pattern that can be spotted during a downtrend. It shows us that the downtrend is weakening, and that bulls are regaining the upper hand.
An inverted hammer cannot be bearish. The bearish version of the inverted hammer is called a shooting star, which is a separate candlestick pattern.
A shooting star forms during an uptrend and indicates a bearish reversal. It shows that bulls tried to push the price higher, but failed, giving the bears the control again. To confirm the pattern, one would expect the next candle to be a bearish one with a close below the shooting star.

An inverted hammer is considered a bullish pattern, no matter its colour – though a green candle is typically seen as a sign of stronger upward momentum. A red inverted hammer does not invalidate the signal but shows that sellers managed to regain some control towards the end of the trading session.
The hammer and inverted hammer are both bullish reversal patterns that appear during a downtrend. The key difference is that the hammer has a small body close to the top and a long lower shadow, while the inverted hammer has a small boy close to the bottom with a long upper shadow.
The hammer is generally considered to be a stronger signal, as bulls were able to push price higher and the session ended near the high. Meanwhile, the inverted hammer shows that the momentum was there initially, but prices got pushed lower again, with the session ending slightly above the low.
It is important to wait for a confirmation of the signal in either case, but particularly so for the inverted hammer.
An inverted hammer is a bullish reversal pattern and will appear during a downtrend. The pattern is easy to spot due to its simple structure:
The instrument is currently in a downtrend. Initially, buyers were able to push the price higher, creating bullish momentum. However, the momentum started to fade, and sellers were able to push the price back towards the open price. Despite that, buyers took back the control and the price bounced back from the low, creating the inverted hammer pattern.
It signals that, despite the struggle in-between, buyers managed to stay in control, paving the way for a trend reversal.
As with all candlestick patterns, an inverted hammer can appear on all timeframes and across all asset classes – from forex to commodities and stocks.
An inverted hammer alone is not good enough, as it could lead to false signals. The key signal for traders is when the next candle closes above the high of the inverted hammer. A strong, bullish candle would indicate that buyers are indeed in control now and improve the odds of a bullish reversal happening.
An inverted hammer gains in significance if it is located near a key support level – this could be a traditional support line or a Fibonacci retracement level.
The first step is spotting the inverted hammer, which is straightforward given its recognisable shape. However, it should appear within an existing downtrend, since the goal is to identify a potential bullish reversal.
Furthermore, if the inverted hammer has formed near a key support level, that improves the odds of a successful reversal.
After the inverted hammer has formed, we will be looking for a bullish candle that closes above the high of the previous candle (the inverted hammer). It is important to wait for the confirmation of the pattern, rather than jumping into the trade as soon as the inverted hammer has formed.

After the confirmation, traders may enter a long position and place the stop loss order just below the low of the inverted hammer.
There is no rule for where to place the take-profit order when trading an inverted hammer. Traders mostly use resistance levels for guidance – for example, they would place the take profit order just ahead of the next significant resistance level, while also keeping in mind the risk-reward ratio.

The inverted hammer pattern can be used alongside technical indicators. For example, it would be a positive sign if the RSI indicator is in oversold territory, but leaves it just as the inverted hammer is formed.
They can also be useful for determining where to exit a trade. For instance, if indicators suggest oversold conditions, that may be a signal of it being time to close a long position.
The inverse hammer is a popular candlestick pattern that signals a bullish reversal following a downtrend. It is easy to spot due to its simple structure and appears on all timeframes and charts of all instruments.
As it is a pattern that can be frequently spotted, it is important to wait for confirmation of the signal and to combine it with other tools.
Ready to trade your edge?
Join thousands of traders and trade CFDs on forex, shares, indices, and commodities!
This information is not to be construed as a recommendation; or an offer to buy or sell; or the solicitation of an offer to buy or sell any security, financial product, or instrument; or to participate in any trading strategy. It has been prepared without taking your objectives, financial situation and needs into account. Any references to past performance and forecasts are not reliable indicators of future results. Axi makes no representation and assumes no liability with regard to the accuracy and completeness of the content in this publication. Readers should seek their own advice.
FAQ
The inverted hammer is a candlestick pattern that signals a bullish trend reversal following a downtrend.
Both patterns indicate a bullish reversal, but a hammer is considered the stronger signal as buyers take more decisive control.
Yes, an inverted hammer candlestick is always a bullish pattern. The bearish equivalent is a shooting star and appears during an uptrend.
Traders wait for confirmation (the next candle closing above the inverted hammer), then enter a long position with a stop-loss below the inverted hammer’s low. Others will seek additional confirmation; for example, did the inverted hammer appear near a key support level? Is the RSI (or a similar indicator) in oversold territory?
As with any candlestick or chart pattern, false signals occur, which is why using stop-loss orders and additional tools for confirmation is crucial.
Yes, they can be found on all timeframes across different markets.

