
Login with email
Login
Login with your email or your MT4 credentials.

What could Bitcoin be worth between 2025 and 2050? It's a question on the mind of every investor and trader. In this article, we’ll explore various forecasts, long-term trends, and the factors that influence Bitcoin’s value, from the present day to a quarter-century from now.
Forecasting Bitcoin's value is inherently speculative. Unlike traditional assets with centuries of data, Bitcoin has only been around since 2009. Its limited track record, high volatility, and rapid technological evolution make long-term predictions highly uncertain. The forecasts you’ll read here are not financial advice; they simply reflect market opinions and data models.
At its core, the Bitcoin blockchain is a public, decentralised digital ledger that records every single transaction. It's maintained not by a single entity but by a global network of computers, or nodes, that work together to keep the system secure.
Transactions are bundled into blocks. Each block contains a limited number of entries and a unique cryptographic code that links it to the previous block, forming a continuous, unbreakable chain of data. To add a new block to the chain, miners compete to solve incredibly complicated mathematical problems using specialised hardware. The first to find the solution earns the right to add the new block and is rewarded with newly created bitcoins and any transaction fees.
Bitcoin’s fixed maximum supply of 21 million coins is a fundamental design feature that makes it a deflationary asset. This built-in scarcity is a major reason why BTC is so often compared to gold.
Bitcoin scarcity is reinforced by a unique mechanism known as the halving cycle. Approximately every 210,000 blocks, or roughly every four years, the reward given to miners for adding a new block is cut in half. These scheduled reductions limit the rate at which new bitcoins are created and released into circulation.
Since Bitcoin's launch in 2009, block rewards have steadily decreased, starting at 50 bitcoins per block. They were then reduced to 25, then to 12.5, and later to 6.25. The most recent halving occurred in April 2024, which reduced the reward to its current level of 3.125 bitcoins per block.
This is the only way new bitcoins enter the system.
Unlike traditional fiat currencies, where central banks can increase the money supply at will, Bitcoin’s supply is strictly controlled by its code to protect the network from inflation.

Because the Bitcoin blockchain is fully transparent, anyone can access and analyse its transaction history. This has given rise to on-chain analysis, a powerful method that uses this publicly available data to understand real-time network activity and user behaviour.
This kind of analysis provides a direct window into how Bitcoin is actually being used, stored, and transferred. Analysts can track everything from basic metrics, like total transaction volume, to more nuanced signals, such as the number of new and active addresses and miner activity. By piecing these together, analysts can spot trends that may signal shifts in market sentiment or even predict future price movements.
BTC is famously volatile and speculative, but its price movements aren't random. They are the result of constant interaction between supply and demand, influenced by a combination of economic, technological, and psychological factors. Let’s dive in:
Year |
Lowest Price (USD) |
Highest Price (USD) |
Average Price* (USD) |
| 2009 |
0.00 |
0.00099 |
0.00099 |
| 2010 |
0.01 |
0.39 |
0.06 |
| 2011 |
0.29 |
32 |
5.27 |
| 2012 |
4 |
16 |
7.38 |
| 2013 |
13 |
1163 |
198 |
| 2014 |
310 |
936 |
525 |
| 2015 |
172 |
465 |
272 |
| 2016 |
351 |
981 |
567 |
| 2017 |
784 |
19,892 |
4,128 |
| 2018 |
3,217 |
18,343 |
7,558 |
| 2019 |
3,401 |
13,017 |
7,343 |
| 2020 |
3,850 |
29,096 |
11,641 |
| 2021 |
29,796 |
68,789 |
43,958 |
| 2022 |
15,500 |
47,835 |
32,663 |
| 2023 |
16,500 |
44,750 |
25,787 |
| 2024 |
38,520 |
108,300 |
93,430 |
*Calculated by taking the sum of the daily closing prices and dividing it by the number of days in the year.
Year |
High |
Year |
Low |
Pullback % |
|
2013 |
1,163 |
2015 |
160 |
-86% |
|
2017 |
20,000 |
2018 |
3,200 |
-84% |
|
2021 |
69,000 |
2022 |
15,500 |
-77% |
Bitcoin’s price history is defined by a series of dramatic boom-and-bust cycles. Each bull market has delivered extraordinary returns, only to be followed by sharp corrections. Historically, Bitcoin has retraced between 70% and 85% from previous all-time highs, with each cycle producing diminishing percentage gains.
Bitcoin’s first reported exchange rate was less than a tenth of a penny in 2009. By 2011, it had reached a milestone of $1 as early adoption began. Following the first halving in November 2012, the price exploded from $11 to over $1,100 within a year. A steep correction followed this historic rally, causing the price to plummet 86% to around $160 by early 2015.
The second halving occurred in July 2016, setting the stage for the next bull market. Bitcoin climbed from about $600 to nearly $20,000 by December 2017, an astounding gain of more than 3,000%. By the end of 2018, it had collapsed to $3,200, an 84% correction that marked the start of the next "crypto winter".
The third halving took place in May 2020, and Bitcoin rallied from below $9,000 to a new all-time high of nearly $69,000 in November 2021, a gain of around 650%. At its peak, the asset’s market capitalisation briefly exceeded $1.25 trillion. A sharp downturn followed, with the price dropping 77% to nearly $15,000 by November 2022.
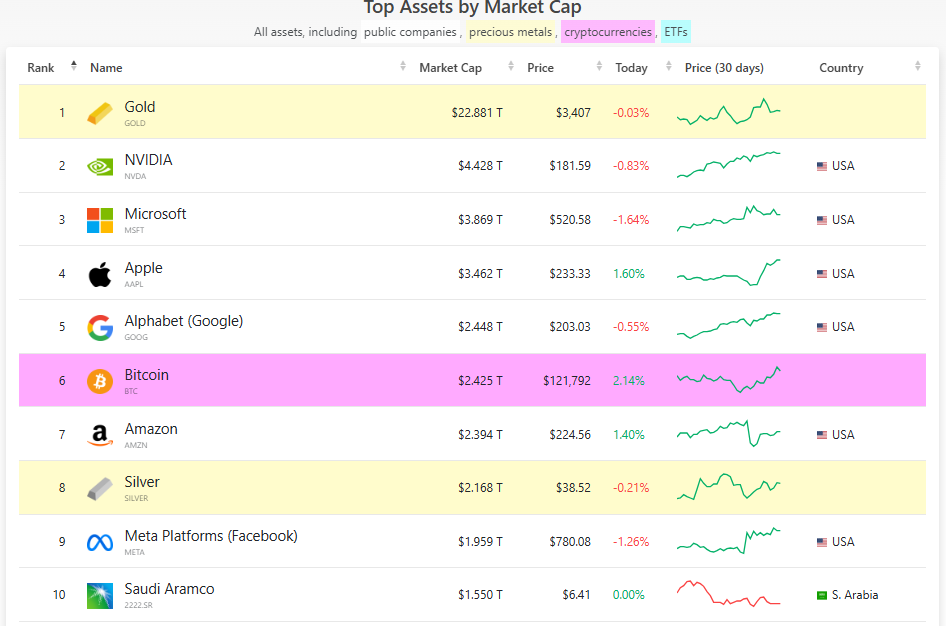
Bitcoin began its current bull cycle in January 2023. The fourth halving took place on April 20, 2024, with Bitcoin trading around $64,500, having reclaimed the key $40,000 psychological level unseen since before the 2022 bear market and the Terra ecosystem collapse. By August 2025, BTC was trading at $125,000, and its market capitalisation had reached $2.45 trillion.
While Bitcoin’s volatility is often a source of contention when compared to traditional assets, this turbulence is not just typical in emerging asset classes; it's necessary for healthy market development.
Each “crypto winter” has historically acted as a cleansing process. It removes weak projects and unsustainable business models, clearing the way for stronger players to emerge in the next cycle. This is a pattern seen before in the wider tech world. After the Dotcom crash, for example, survivors like Amazon and eBay went on to become the dominant market leaders of their era. In the crypto space, the projects that endure the bear market often become the market leaders of the following bull run.
Bitcoin supply dynamics and market structure are looking bullish. Reserves on centralised exchanges are at their lowest levels since 2018, a clear sign of aggressive accumulation and a move towards self-custody by both retail and institutional holders. This shift has led to a significant change in the market's composition, with over 75% of the total BTC supply now held by long-term investors. This trend creates a demand-side imbalance and supports a bullish price structure, a key indicator for traders in spot, perpetuals, and leveraged instruments.
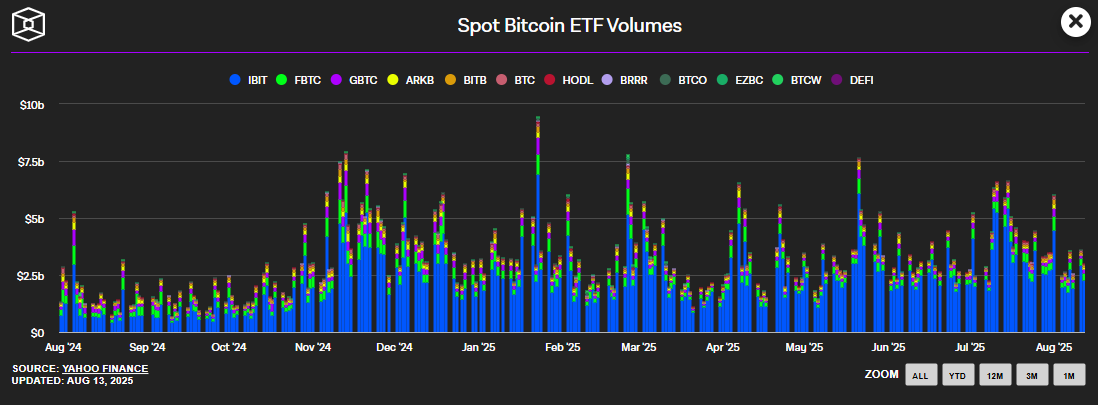
The launch of Bitcoin ETFs in early 2024 was a major turning point for the crypto market. These products offered traditional investors seamless exposure to Bitcoin without the complexities of managing wallets or custody. ETF demand continues to exert significant upward pressure on spot markets.
This institutional interest has been staggering, with total ETF inflows now exceeding $50 billion. A considerable portion of this, some $14–15 billion, has entered the market in 2025 alone. Activity spiked particularly in July 2025, following a series of pro-crypto legislative announcements in the US. These institutional flows are creating cascading effects, influencing everything from derivatives pricing to overall market depth.
Under the Trump administration, the U.S. has adopted a pro-crypto stance that is now reshaping global sentiment. The new regulatory clarity has significantly boosted institutional confidence, which in turn is supporting ETF flows, futures open interest, and long-term positioning. This shift is built on several key developments:
Bitcoin-linked stocks such as Coinbase, MicroStrategy, and major mining firms have outperformed BTC itself in 2025. This reflects growing interest from equities traders who are using these stocks as a way to gain exposure to crypto markets. These assets now function as proxy instruments for Bitcoin, often leading or confirming its directional bias.
The 2022 collapses of FTX, Terra, and others triggered widespread deleveraging. Since then, the market has staged a strong recovery, strengthened by improved regulation, institutional buy-in, and innovative new products. The convictions of key bad actors and structural cleanup have also increased trust, bringing significant benefits for traders, including reduced counterparty risk and more predictable liquidity.
Bitcoin's market capitalisation positions it as one of the top global assets. As inflation, de-dollarisation, and geopolitical instability intensify, Bitcoin is increasingly seen as a crucial macro hedge. For all types of investors, this narrative supports long-term accumulation, while its inherent volatility continues to offer frequent short-term setups for active market participants.
Source/ Year |
2025 |
2026 |
2030 |
2040 |
2050 |
|
Bitwise |
200K |
* |
1M (2029) |
* |
* |
|
Bitmex & Arthur Hayes |
250K |
* |
3M |
* |
* |
|
Coincodex Algorithm |
* |
109,591 |
157,469 |
1.2M |
1.5M |
|
VanEck |
180K |
* |
300K |
* |
2.9M |
|
Coinpedia |
70K–175K (avg. 120K) |
150K-230K (avg. 200K) |
380K-900K (avg. 750K) |
5.8M-13.5M (avg. 9.6M) |
162M- 378M (avg. 270M) |
|
Cryptonews |
115K |
202,881 |
1.23M |
* |
* |
|
Fundstrat’s Tom Lee |
150K-250K |
* |
3M |
* |
* |
|
Robert Kiyosaki |
250K |
* |
1M |
* |
* |
|
Adam Back |
500K-1M |
* |
* |
* |
* |
|
Standard Chartered |
200K |
* |
500K(2029) |
* |
* |
|
Stock-to-Flow Model (PlanB) |
250K-1M |
200K-600K |
2.5M-10M |
25M- 100M |
250M-1B |
|
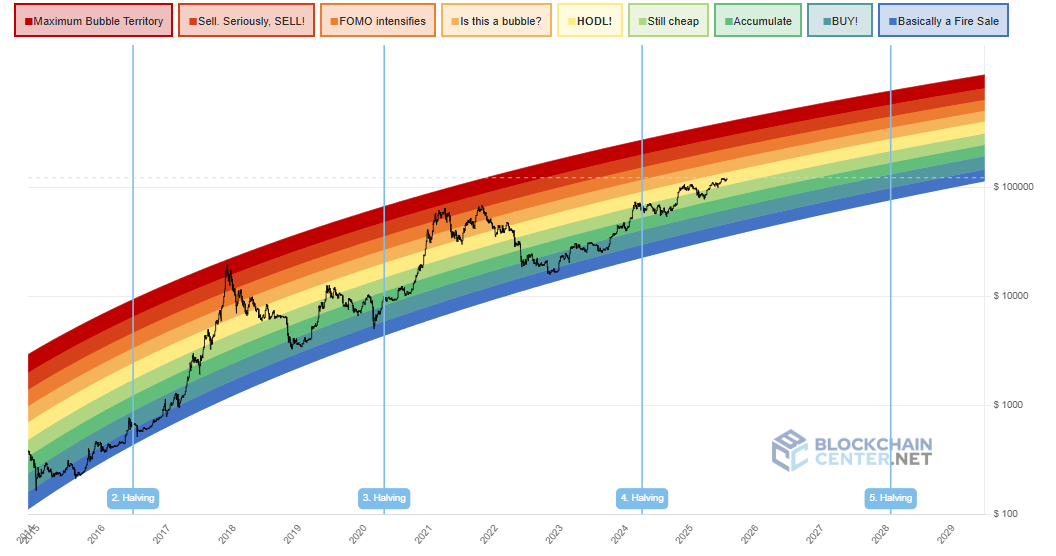
Bitcoin Rainbow Chart |
200K-700K (avg. 450K) |
300K-500K (avg. 400K) |
1M-5M (avg. 3M) |
* |
* |
|
Mike McGlone Bloomberg |
10K |
* |
* |
* |
* |
|
Ark Invest |
* |
* |
300,000-1.5M |
* |
* |
|
Tim Draper (Venture Capitalist) |
250K |
* |
* |
* |
* |
|
Michael Saylor |
* |
* |
* |
* |
13M |
* Price prediction not provided from this source for this year
Forecasting Bitcoin’s value for 2025 has produced a wide range of outcomes, from extreme bullishness to outright caution. However, a core consensus among analysts suggests a significant upside, primarily driven by institutional demand and post-halving supply shocks.
A strong cluster of predictions from institutional players places BTCUSD in the $150,000 to $250,000 range. Bitwise, for example, maintains a target of $200,000, with a potential upside to $230,000. CIO Matt Hougan points to overwhelming institutional demand and Bitcoin’s role as a long-term hedge against sovereign debt. Standard Chartered echoes this thesis, forecasting a similar $200,000 target by the year's end.
Similarly, VanEck projects a moderate, data-driven price of approximately $180,000, believing Bitcoin is entering a bullish cycle supported by institutional adoption and technical strength. From a traditional finance perspective, Fundstrat’s Tom Lee foresees Bitcoin reaching $150,000, with the possibility of overshooting to $250,000. Cryptonews offers a more moderate but still bullish outlook of $115,000, balancing long-term positive factors with the typical price stabilisation that follows a halving.
The most extreme forecasts come from influential figures with strong ideological convictions. Arthur Hayes and venture capitalist Tim Draper both see Bitcoin reaching $250,000, with their views rooted in U.S. wartime economics and a belief that fiat currencies are being devalued. Robert Kiyosaki, author of Rich Dad Poor Dad, shares this sentiment, projecting $250,000 as "insurance" against a failing financial system. Adam Back of Blockstream presents the most extreme bullish case, forecasting Bitcoin between $500,000 and $1 million, reflecting a view of parabolic expansion driven by sovereign adoption.
On the bearish side, Mike McGlone from Bloomberg Intelligence stands as the primary contrarian. He warns that Bitcoin could fall to $10,000 in 2025, arguing it remains vulnerable to macroeconomic shocks and could underperform in a major recession.
Polymarket, a decentralised prediction platform, shows a median price of $138,617 for 2025, based on the collective view of its users. This outlook is linked to momentum from the halving and improving economic conditions. Overall, while forecasts for 2025 range from $10,000 to $1 million, the consensus from respected sources clusters between $150,000 and $250,000.
Looking ahead to 2026, the consensus among analysts and algorithmic models is that Bitcoin will continue its upward trajectory, with most forecasts clustering between the $100,000 and $230,000 marks. This optimism is driven by important long-term factors, including deeper financial integration, improved macroeconomic conditions, and clearer regulation.
For instance, Cryptonews projects a price of $202,880, citing increased pension fund exposure and the adoption of Runes and Ordinals. Similarly, CoinCodex, which uses algorithmic models, predicts a trading range between $99,933 and $117,989, anticipating steady growth. Coinpedia expects Bitcoin to reach between $150,000 and $230,000 on the back of ongoing institutional adoption and the long-term effects of the halving cycle.
The Bitcoin Rainbow Chart, a sentiment-based logarithmic model, offers an even more bullish prediction, placing Bitcoin in a range between $300,000 and $500,000 for the year.
In summary, the consensus view is that institutional participation, regulatory clarity, and continued integration with traditional finance will be the key drivers, pushing Bitcoin's value into a new, higher price bracket.
Looking towards 2030, a period that will see another Bitcoin halving, forecasts span a wide range from the hundreds of thousands to multi-million dollar targets. The core of these long-term predictions reflects a belief in Bitcoin’s evolving role from a speculative asset to a foundational part of the global financial system. Among institutional forecasters, the long-term price predictions are overwhelmingly bullish. Cathie Wood of ARK Invest predicts Bitcoin will reach at least $1.5 million by 2030, citing its growing use in corporate treasuries and its role as a non-sovereign store of value. VanEck forecasts Bitcoin could reach $300,000, and sees a long-term possibility of $1 million. Bitwise also holds a similar long-term view, targeting a price above $1 million by 2029 if Bitcoin's market capitalisation surpasses gold's.
The models and quantitative platforms offer a more varied but still optimistic picture. PlanB’s (revised) Stock-to-Flow (S2F) model, a widely referenced valuation tool, forecasts a significant 2030 range of $2.5 million to $10 million. This projection is based on the model’s core assumption that increasing scarcity from the 2028 halving will drive significant price appreciation.
On the more conservative side, CoinCodex predicts a price of $157,469 based on algorithmic trend modelling without exponential growth assumptions.
Several prominent figures with strong ideological convictions also foresee a massive long-term upside. Both Robert Kiyosaki and Arthur Hayes believe Bitcoin will reach $1 million by 2030, driven by a breakdown in trust in fiat currencies. These views are echoed by Cryptonews and Coinpedia, which project prices in the high six figures to over $1 million, supported by mass adoption for payments.
By 2040, a pivotal year coinciding with Bitcoin’s 8th halving, 99.8% of all bitcoins will have been mined. This creates an unprecedented supply constraint that long-term models agree could lead to multi-million-dollar valuations, despite differing on the exact numbers.
Algorithmic models from CoinCodex forecast a 2040 BTC price of around $1.2 million, based on projected growth across multiple halving cycles. In contrast, Coinpedia presents a far more bullish outlook, projecting a price range between $5.8 million and $13.5 million, based on the assumption of continued adoption and extreme scarcity. While these forecasts differ in their exact numbers, the core message is consistent: Bitcoin’s unique design and its eventual near-complete issuance are consider powerful drivers that could support multi-million-dollar valuations in the coming decades.
Looking towards 2050, predictions for Bitcoin diverge dramatically, reflecting a deep uncertainty about its future role in the global financial system. The key question is whether it will remain an alternative asset or evolve into a foundational component of the world's monetary infrastructure.
On the conservative end, CoinCodex forecasts a price of around $1.5 million. A more detailed institutional case from VanEck projects Bitcoin could reach $2.9 million, based on a scenario where it becomes a global medium of exchange and a reserve asset for central banks.
At the other end of the spectrum, an ultra-bullish outlook from Michael Saylor, CEO of Strategy, reflects a belief that Bitcoin will fully displace traditional stores of value, projecting a price of $13 million by 2045. Coinpedia's forecast for 2050 is an even more extreme range between $162 million and $378 million.
In summary, 2050 forecasts range from $1.5 million to an astonishing $378 million. The wide variance reflects deep uncertainty and differing assumptions, but all views underscore a core consensus: if Bitcoin succeeds in its long-term mission, its value will be in the millions, driven by its growing role in global finance.
Experts anticipate a transformative period for the cryptocurrency market, driven by events like Bitcoin's halving cycles, continued innovation, and institutional adoption. The broad consensus points to a maturing market with significant upside potential.
However, this journey is not without risks. As the market remains inherently volatile and sensitive to external factors, a balanced approach of optimism and realistic risk assessment is crucial. Staying informed and exercising due diligence will be essential for anyone looking to understand and capitalise on the future of Bitcoin and the broader cryptocurrency landscape.
Ready to trade your edge?
Join thousands of traders and trade CFDs on forex, shares, indices, commodities, and cryptocurrencies!
References to forecasts and past performance are not reliable indicators of future results.
The images shown are for illustration purposes only. Data is sourced from third party providers.
This information is for educational purposes only and is not intended to be financial product advice or any investment recommendation. It is not to be construed as a recommendation; or an offer to buy or sell; or the solicitation of an offer to buy or sell any security, financial product, or instrument; or to participate in any trading strategy. It has been prepared without taking your objectives, financial situation and needs into account. Axi makes no representation and assumes no liability with regard to the accuracy and completeness of the content in this publication. Readers should seek their own advice.

