
Login with email
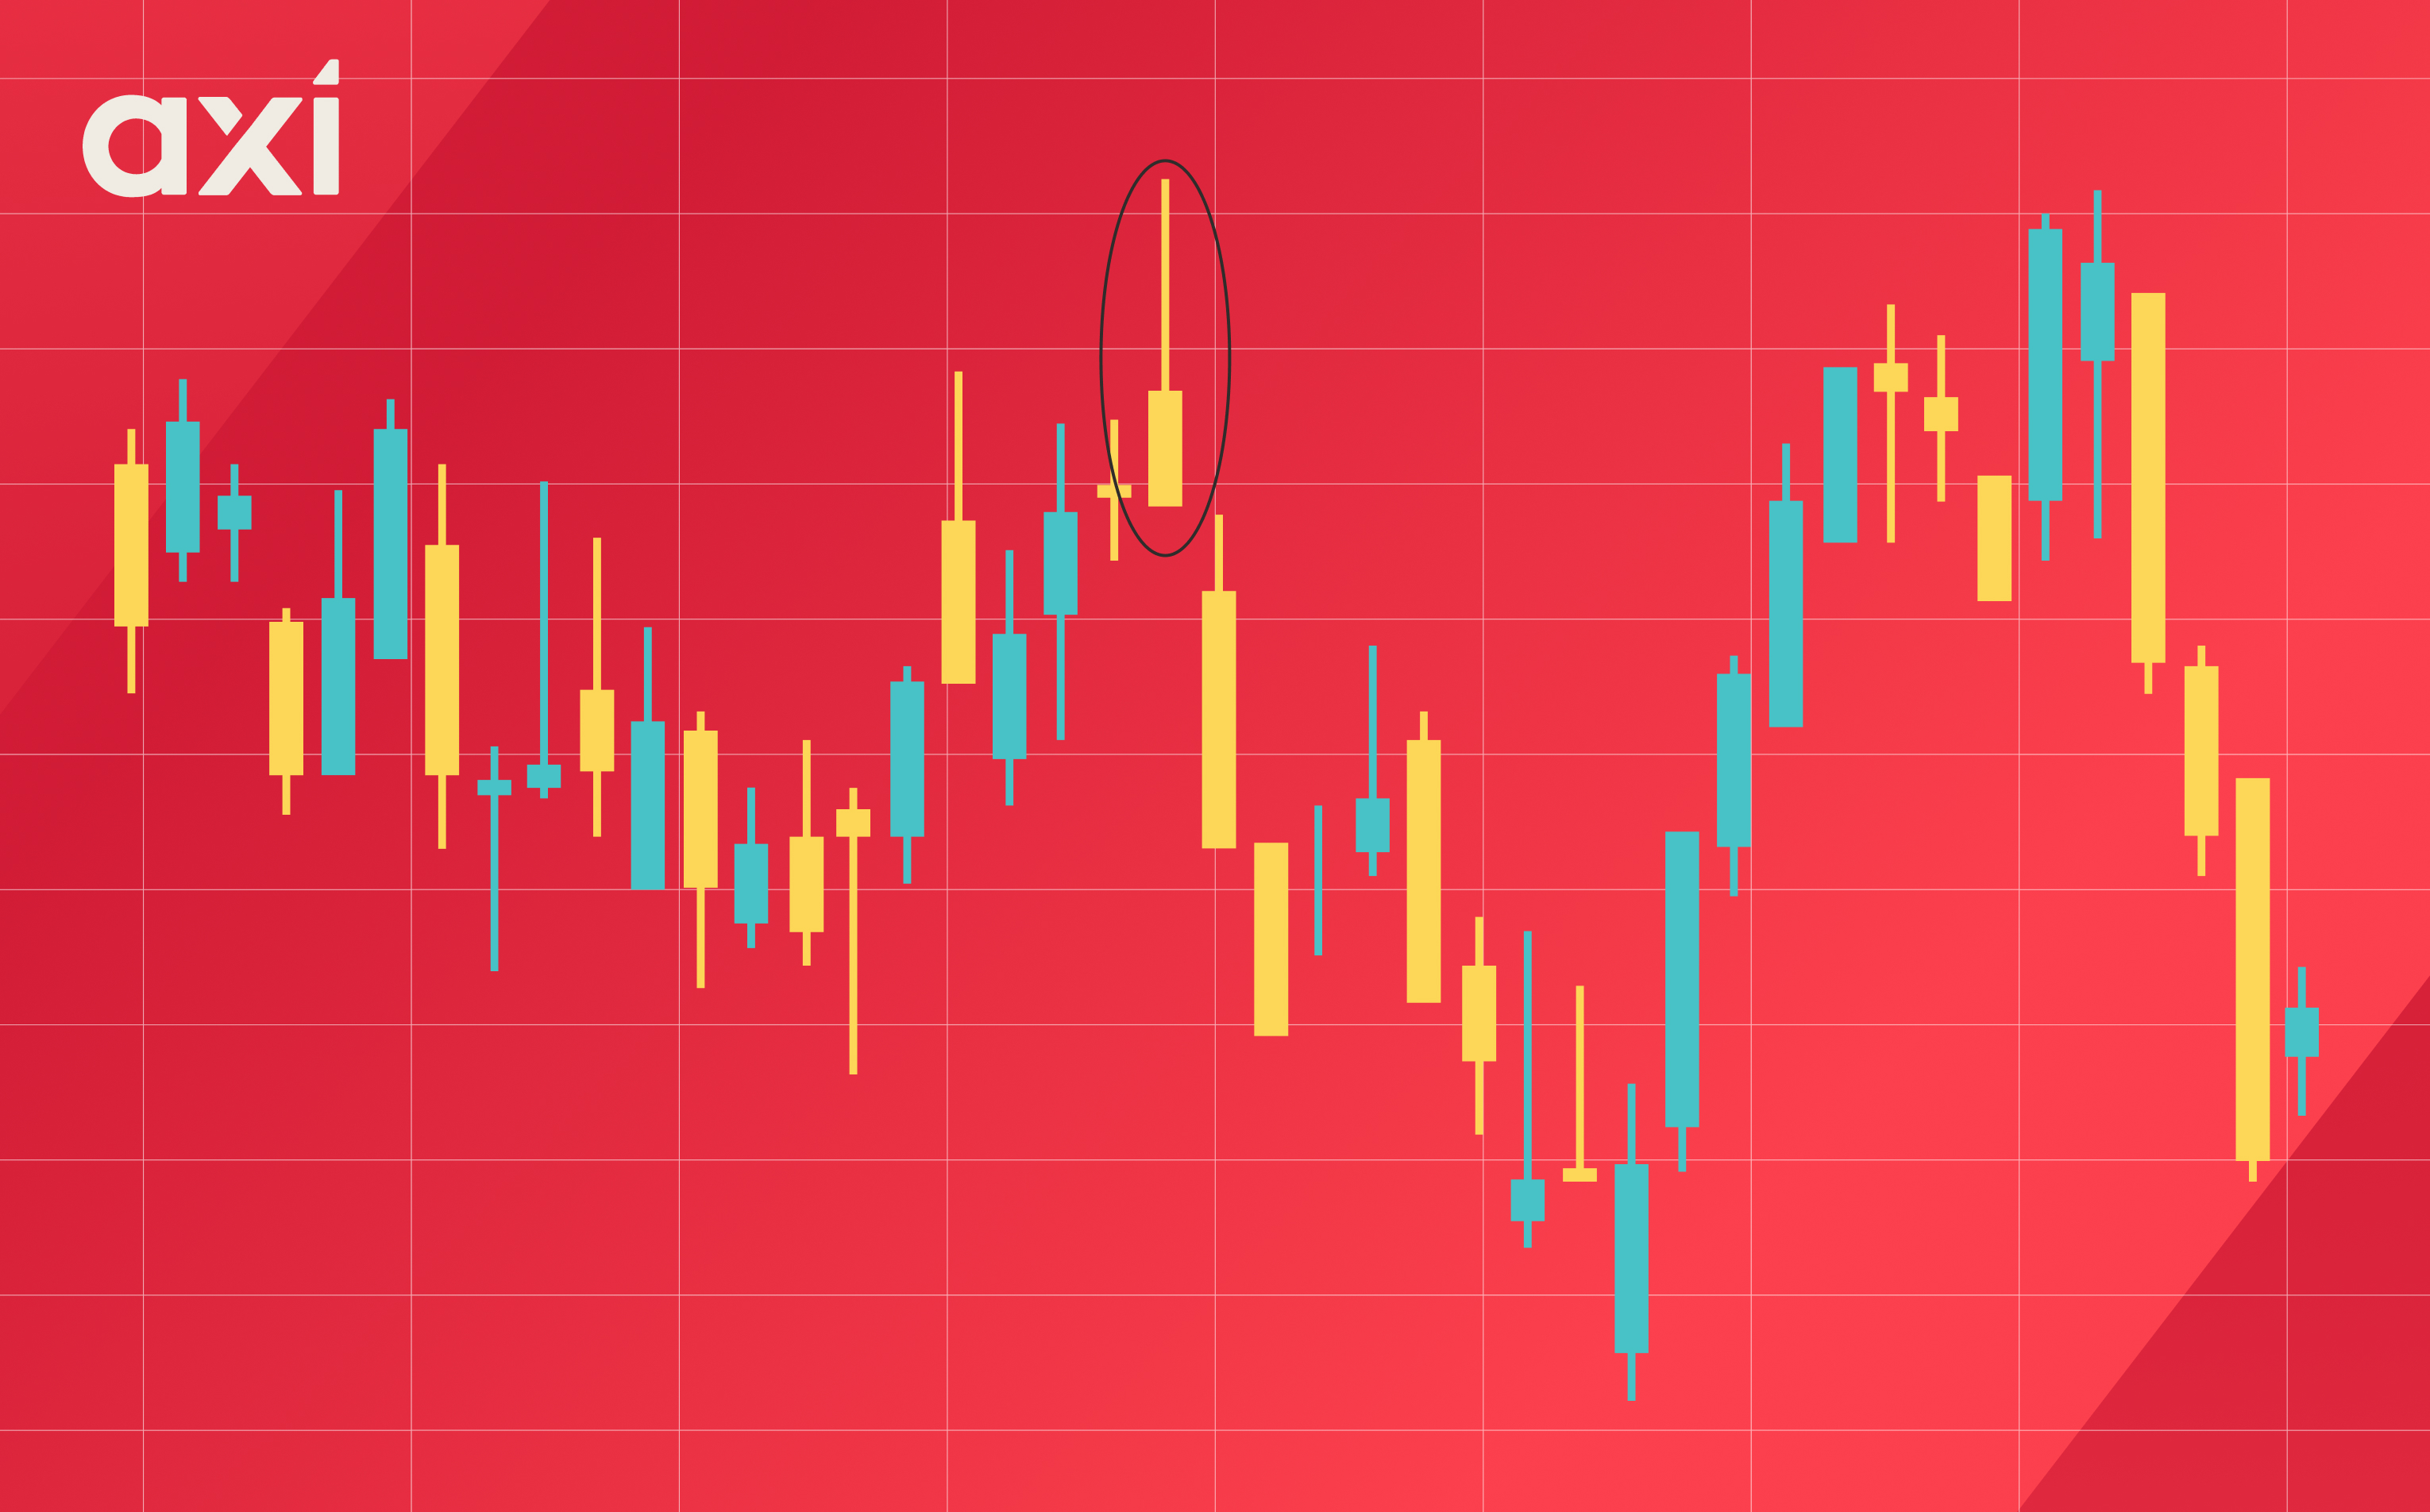
A shooting star is a candlestick pattern that signifies a bearish reversal. It appears as a candlestick with a small body positioned near the low, little to no lower shadow, and a long upper shadow.
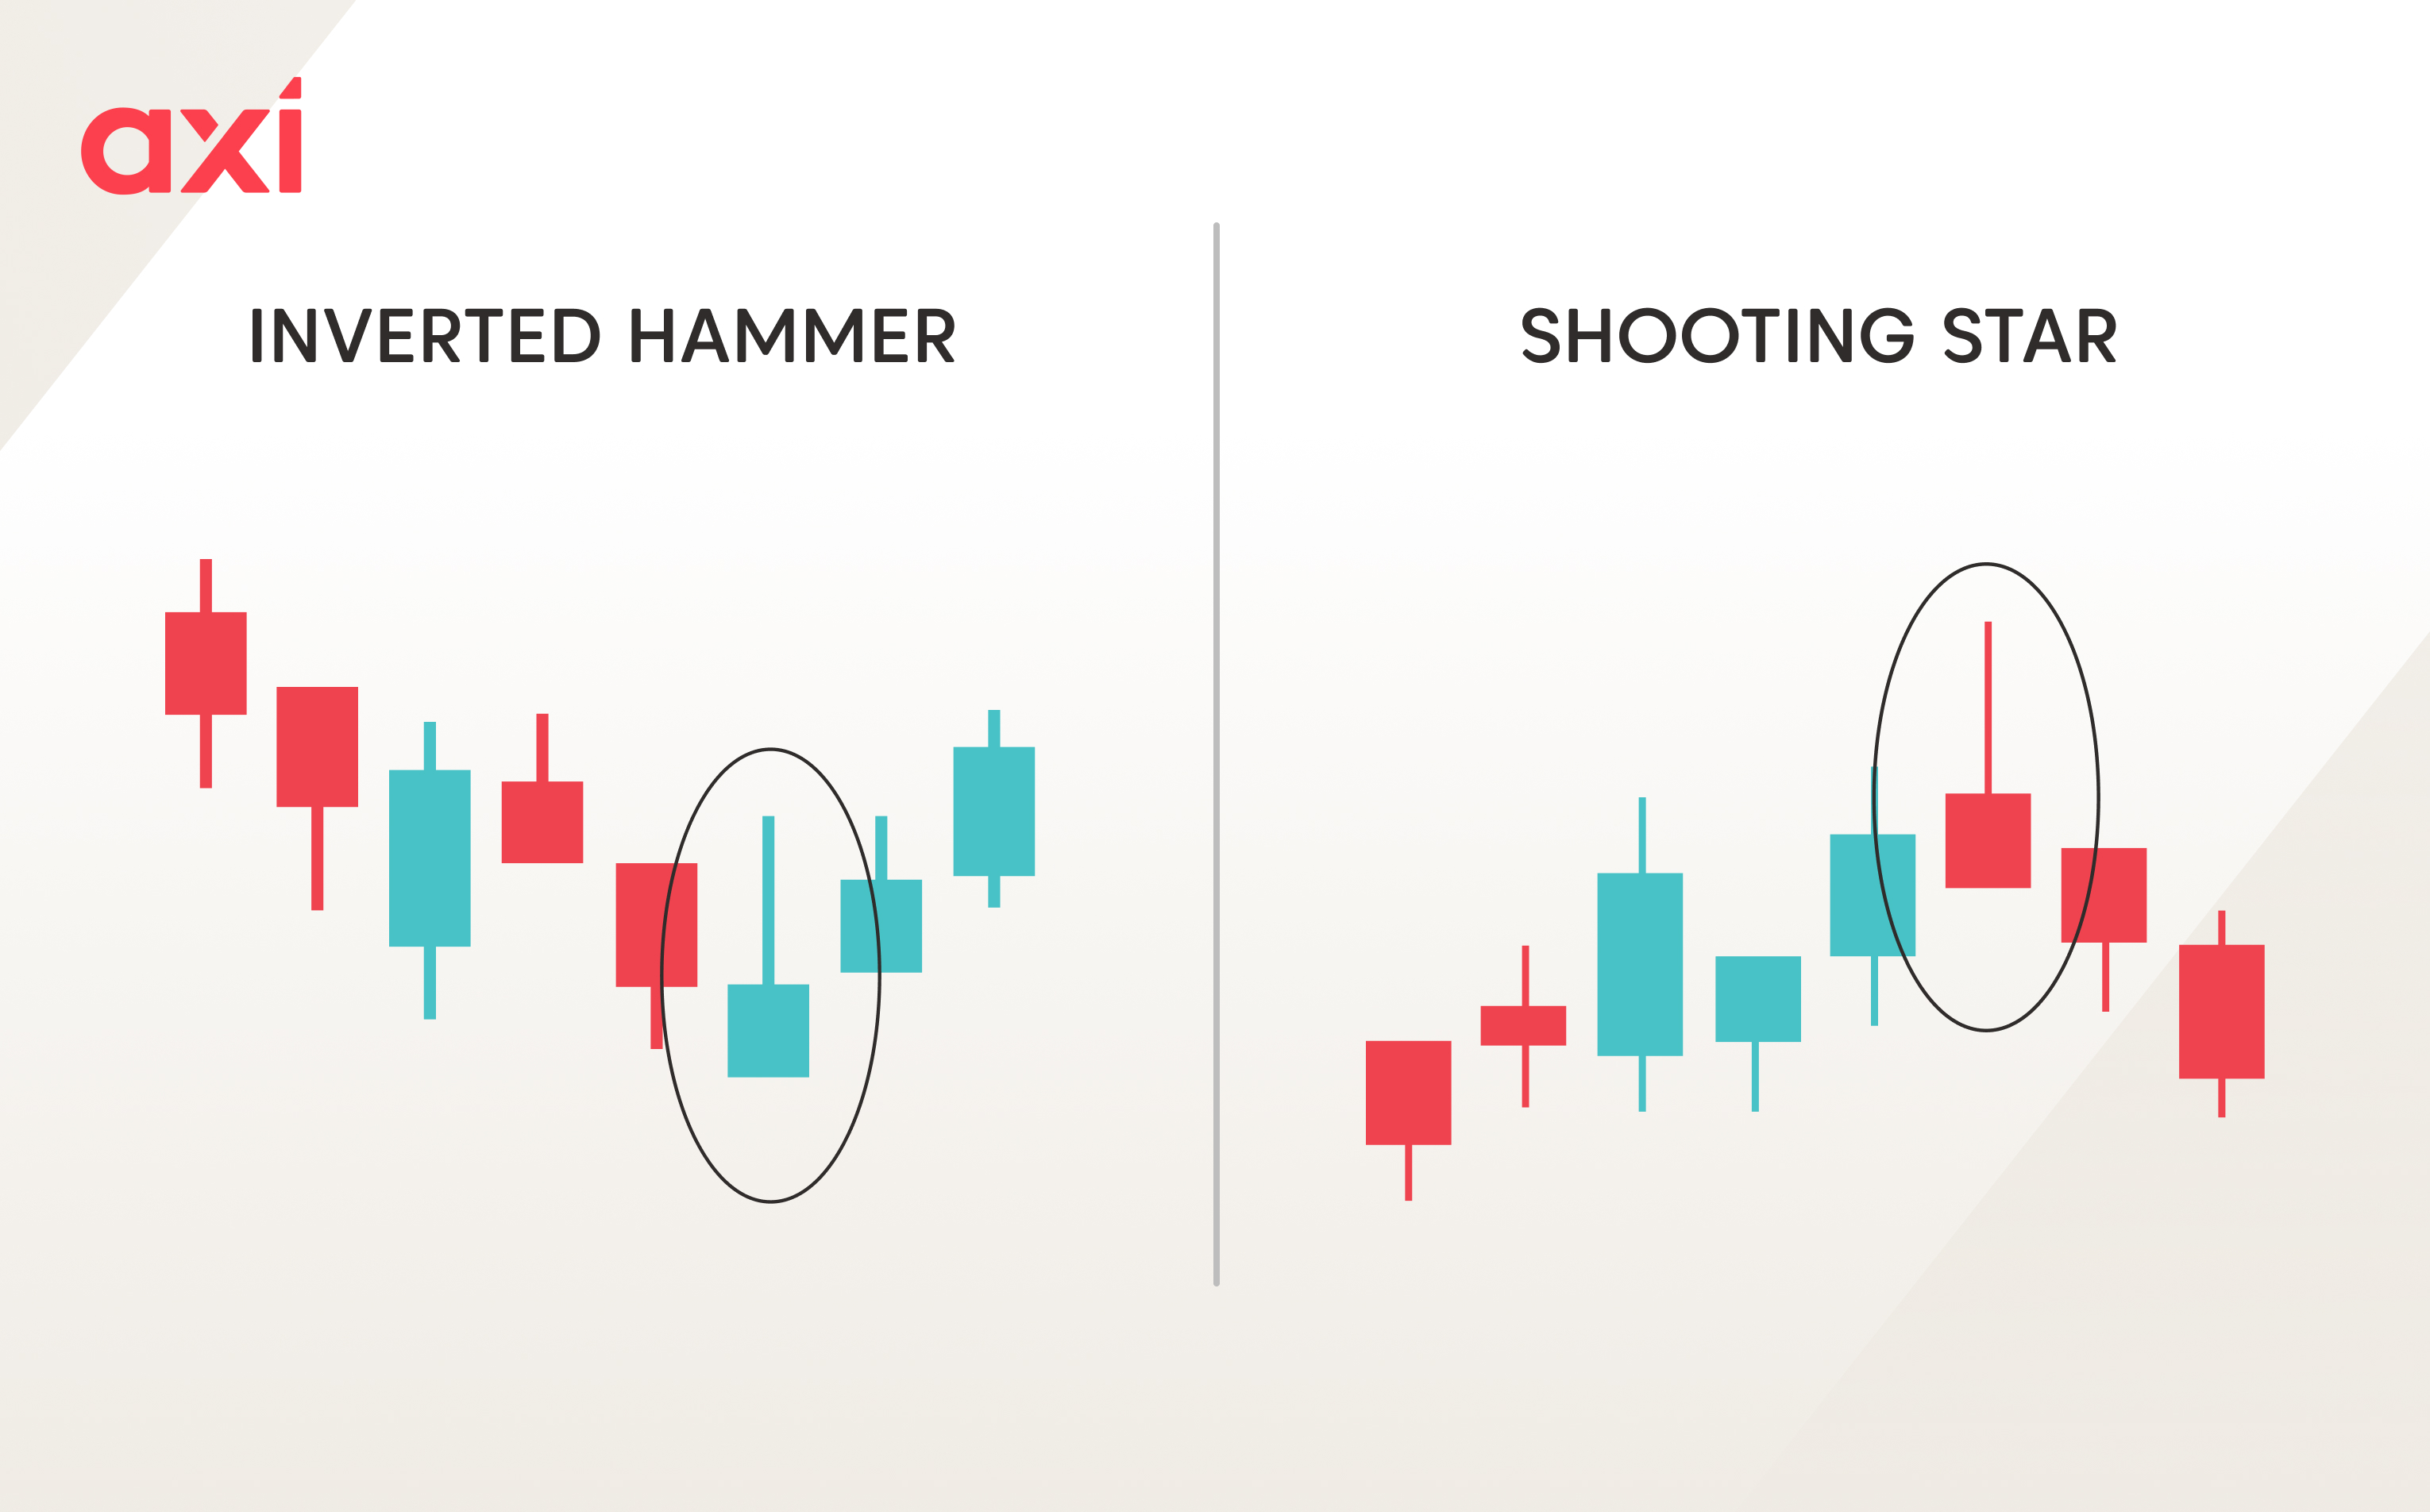
The shooting star resembles the inverted hammer; however, the key difference is that the shooting star appears during an uptrend and signals a bearish reversal, whereas the inverted hammer occurs during a downtrend and indicates a bullish reversal.
The shooting star appears during an uptrend. Initially, when the shooting star forms, buyers manage to push the price even higher. However, suddenly, significant selling pressure emerges, driving the price lower and resulting in a large upper wick. Eventually, the price stabilises, and the candle closes with a small body, indicating little difference between the opening and closing prices, positioned near the session low.
The candlestick indicates that buyers experienced considerable pressure, suggesting a potential shift in market sentiment as sellers took control. This pattern becomes even more significant if it occurs near a key resistance level.
The shooting star is easy to identify and appears fairly frequently. It can appear on all chart timeframes of all tradable instruments.
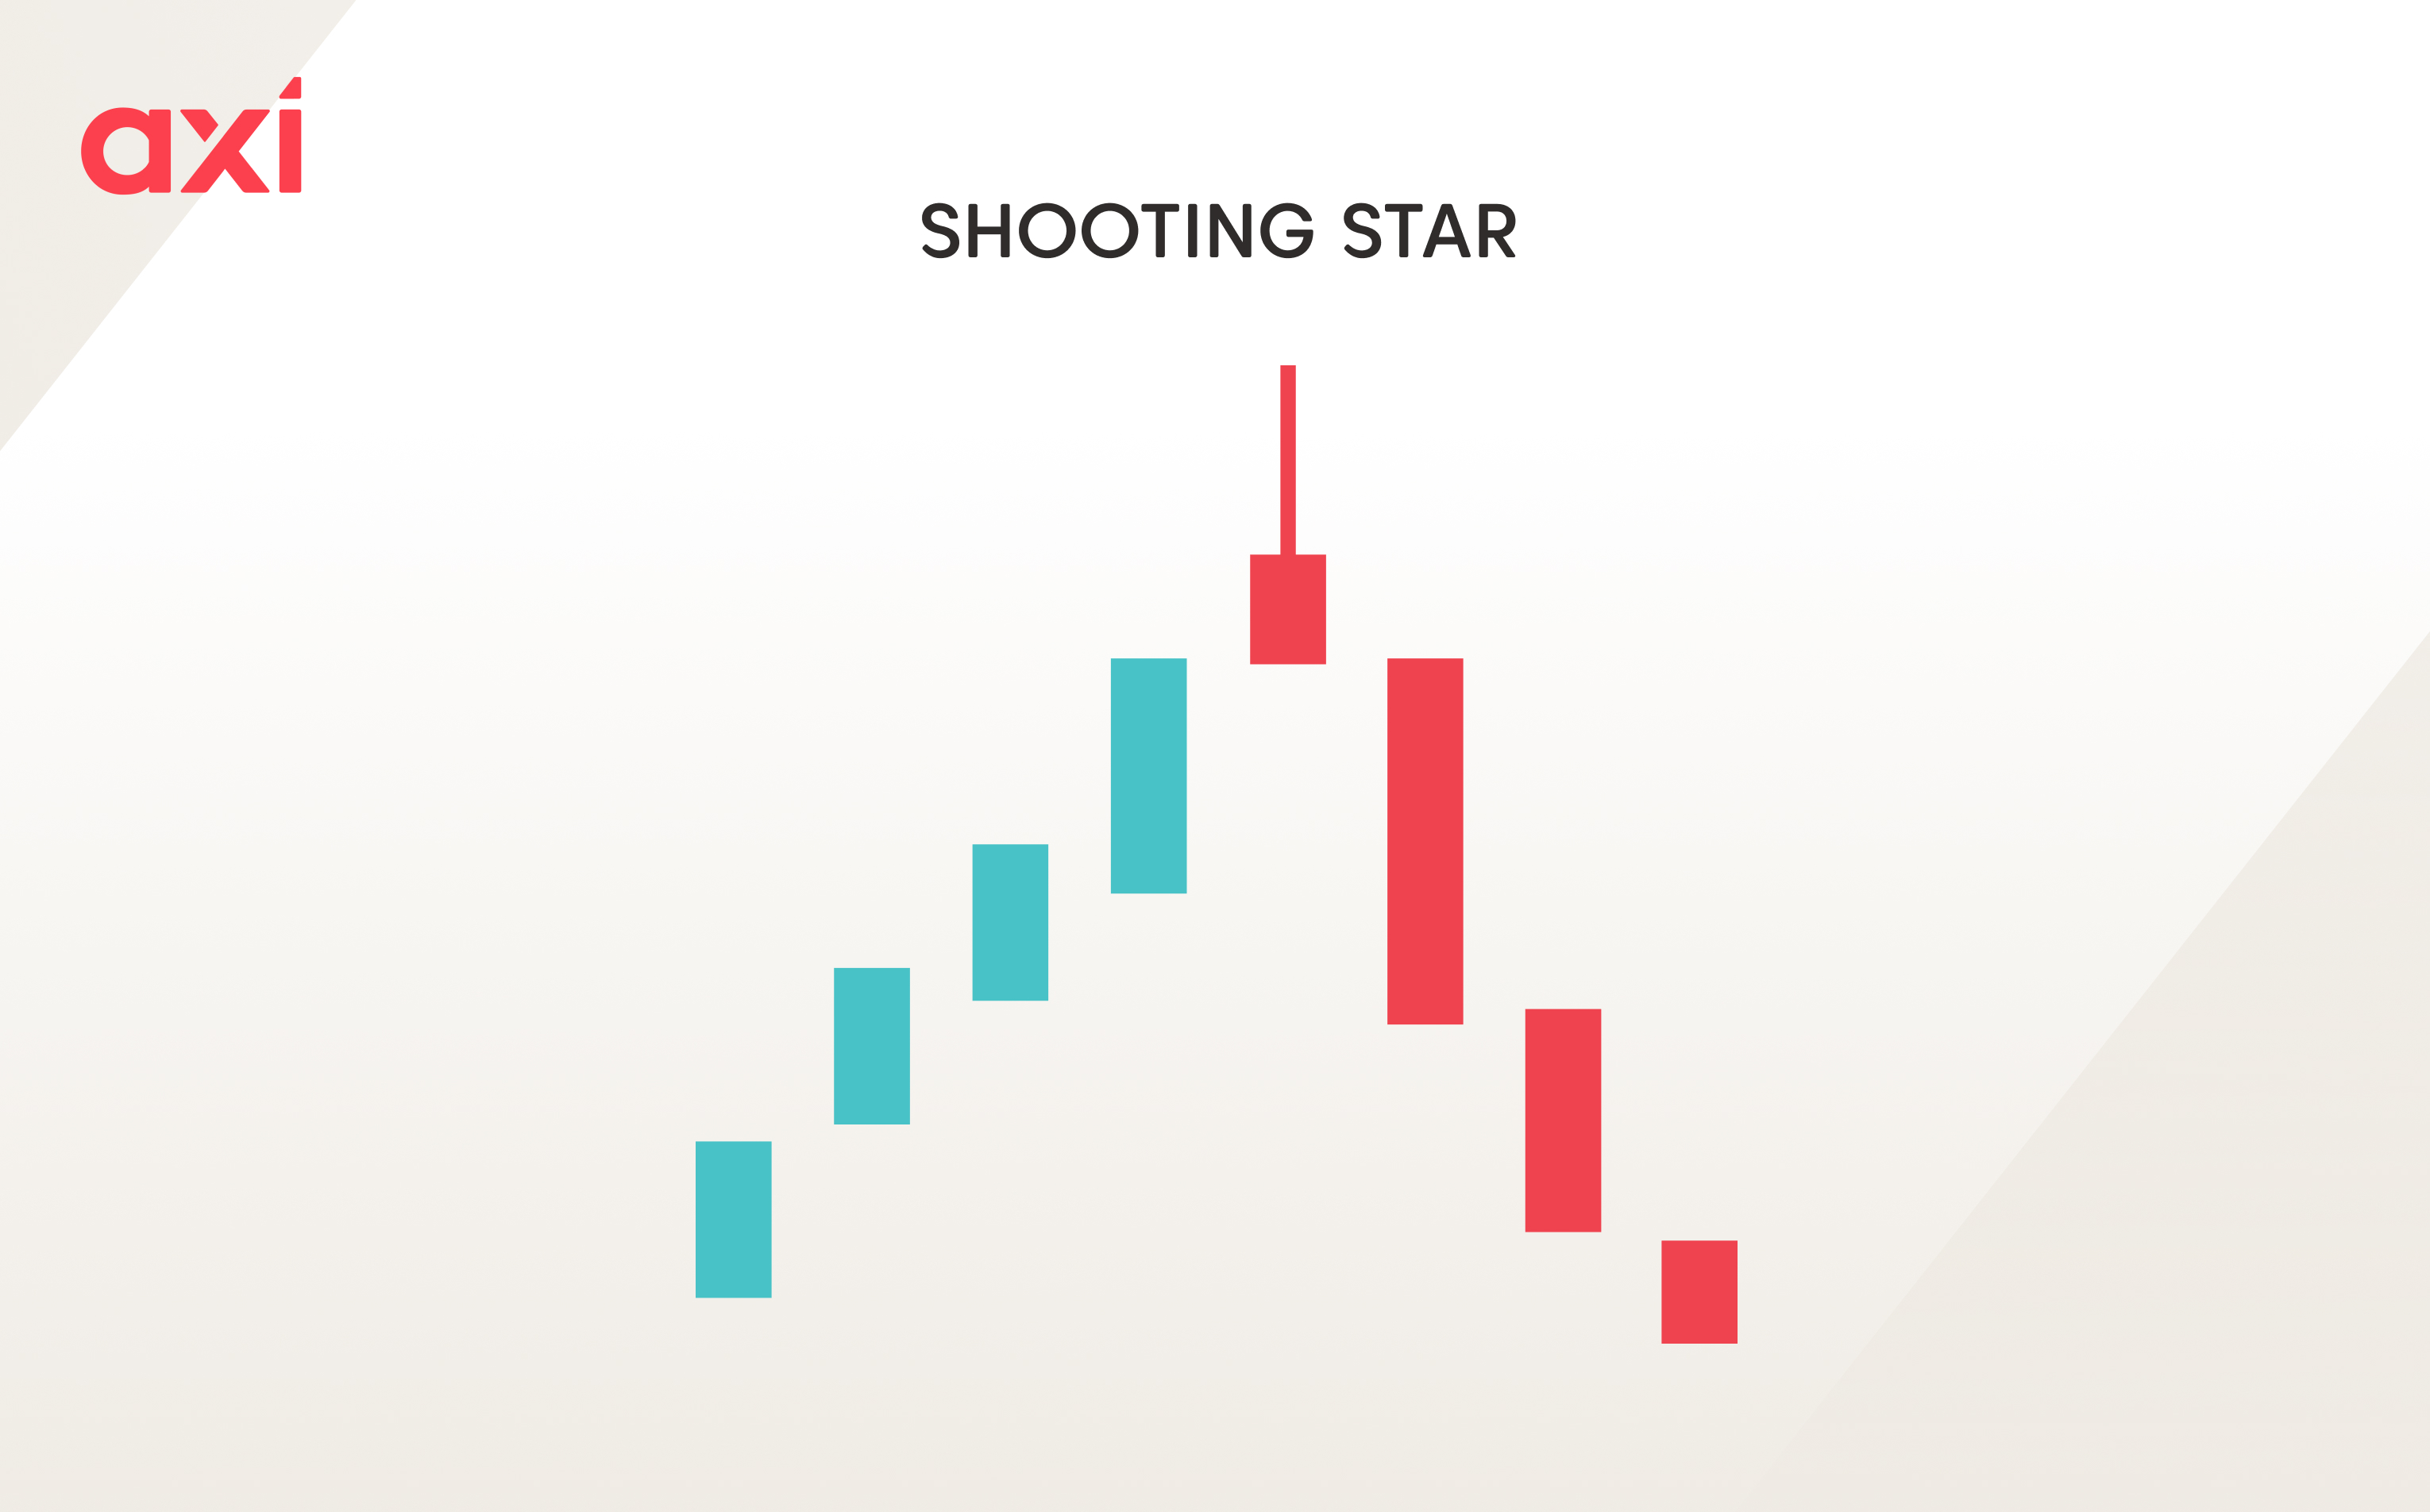
The candlestick itself has a small body located near the low of the session, meaning it finished the session near to the opening price.
It has a long upper shadow, ideally twice the size of the body or more, indicating a loss of buyer control and significant selling pressure.
Finally, it has no or a small lower shadow, indicating that while sellers were able to regain control, they failed to push the price significantly below the opening price.
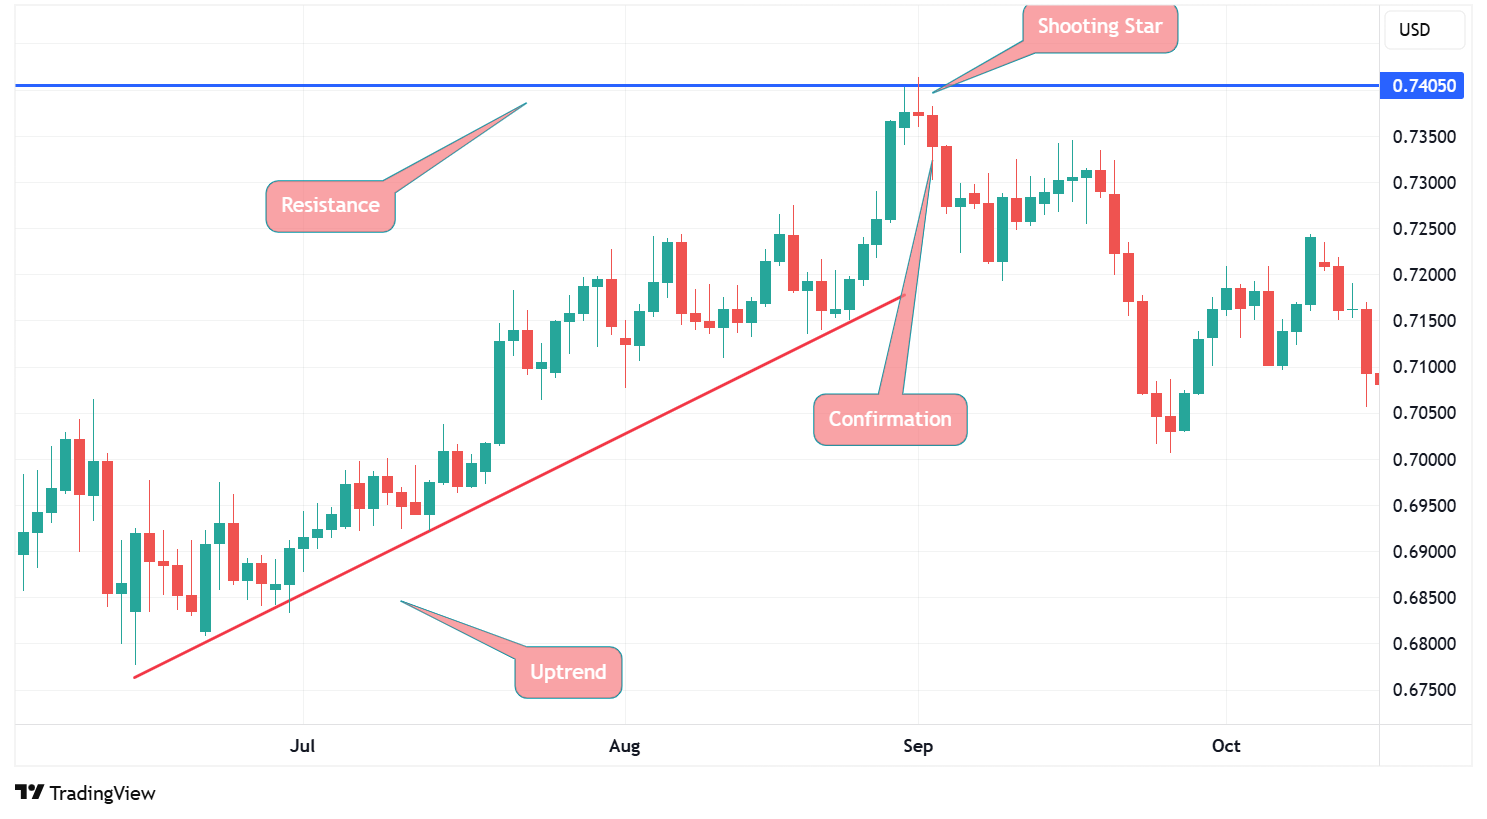
First, it is essential to establish that the instrument is currently in an uptrend. This is crucial, as the shooting star is exclusively a bearish reversal pattern.
Once a shooting star is identified, traders will wait for a confirmation of the signal (bearish reversal). This confirmation is provided by the subsequent candlestick, which should be bearish and close below the body of the shooting star.
Data is sourced from third party providers.
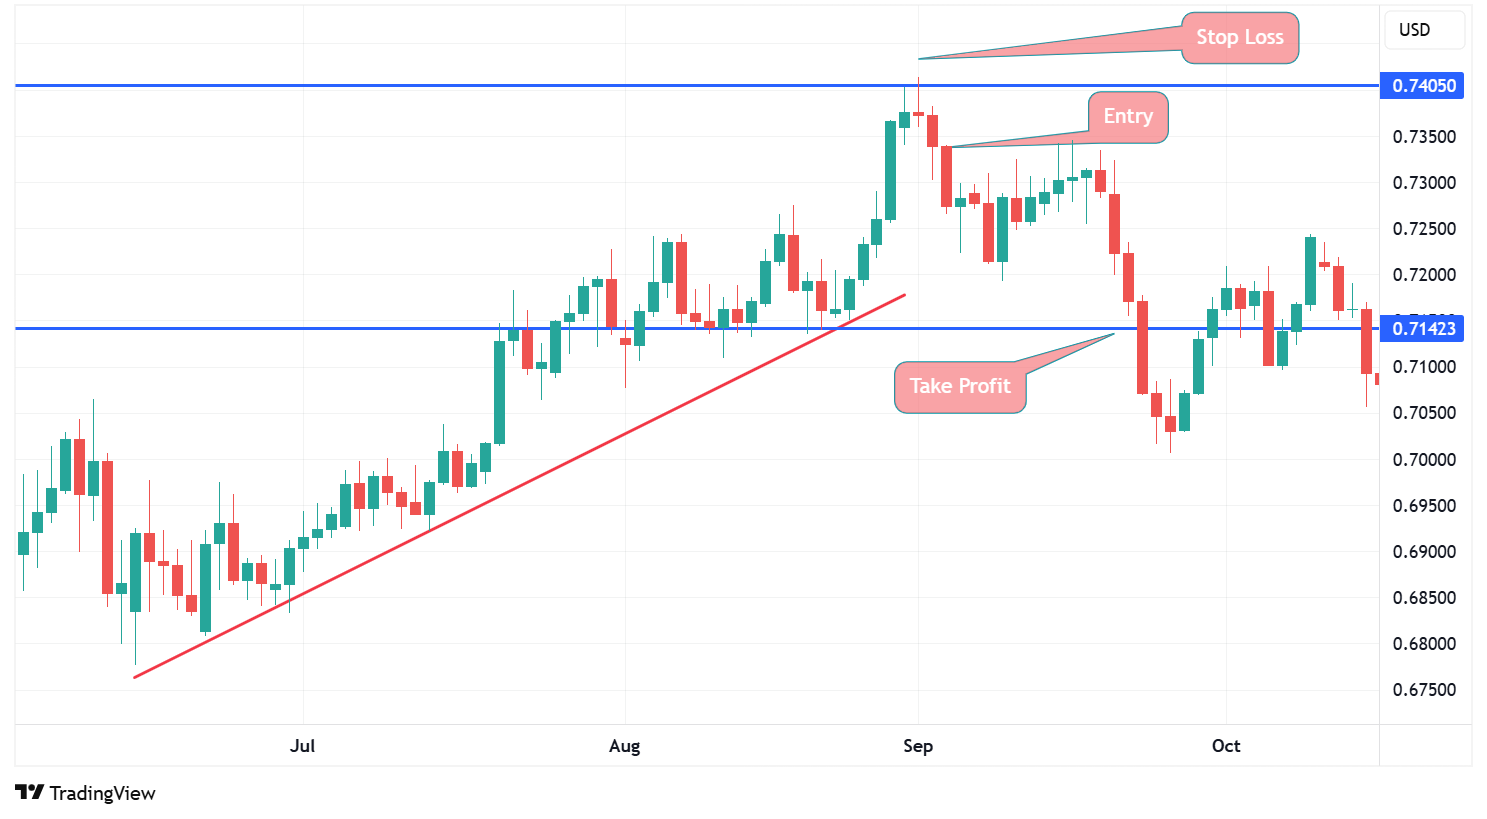
After the confirmation has been obtained, traders will enter a short position and place the stop-loss order just above the high of the shooting star.
The shooting star pattern does not provide any guidance regarding where to place the take-profit order. Instead, traders typically utilise the next significant support level as an exit point. This may take the form of a classic support level, a Fibonacci level, or a pivot point. It is crucial to consider the risk-reward ratio, which should ideally be set at 1:2 or higher.
Data is sourced from third party providers.
A shooting star can appear anywhere, but traders tend to pay even closer attention to the pattern if it appears close to a significant resistance level, as it improves the quality of the signal.
As with any candlestick pattern, trading a shooting star can be combined with various technical indicators. For example, the Relative Strength Index (RSI) or MACD can give us an indication of whether the market is already in overbought territory.
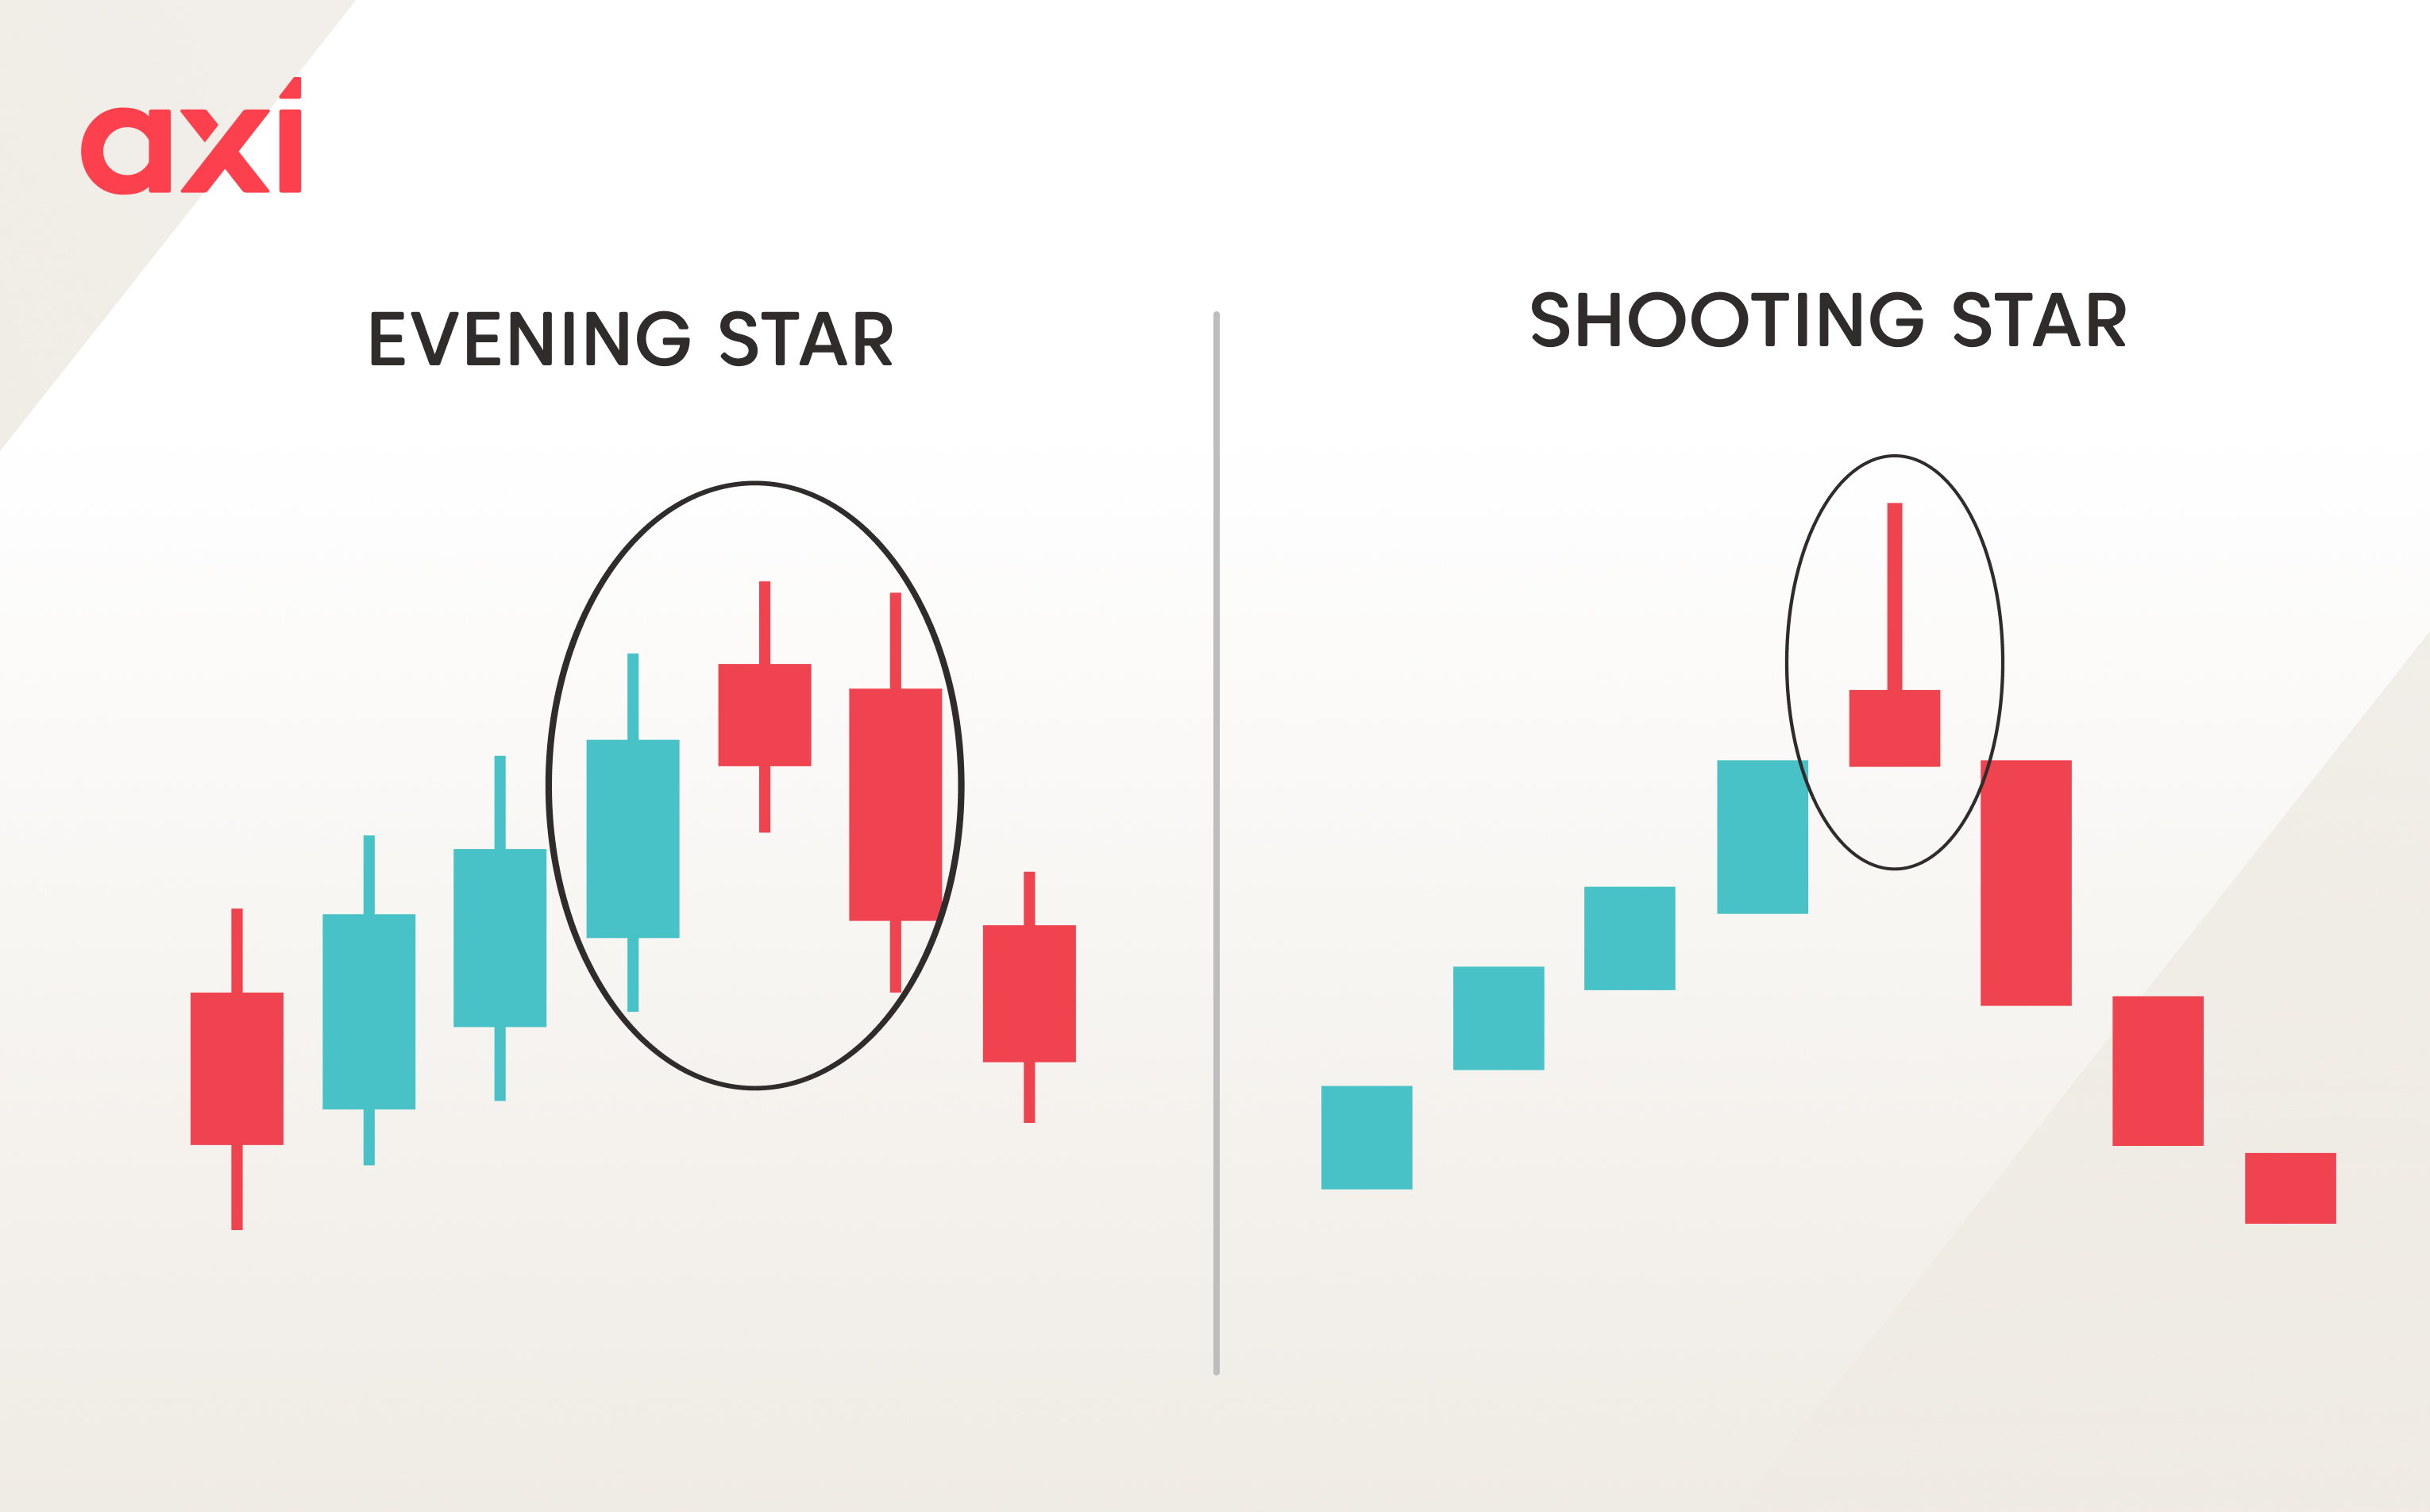
While both the evening star and the shooting star appear in uptrends and signal potential bearish reversals, they differ significantly in structure. The evening star is a three-candle pattern that includes a confirmation candle (the final bearish candle), whereas the shooting star is a single-candle formation.
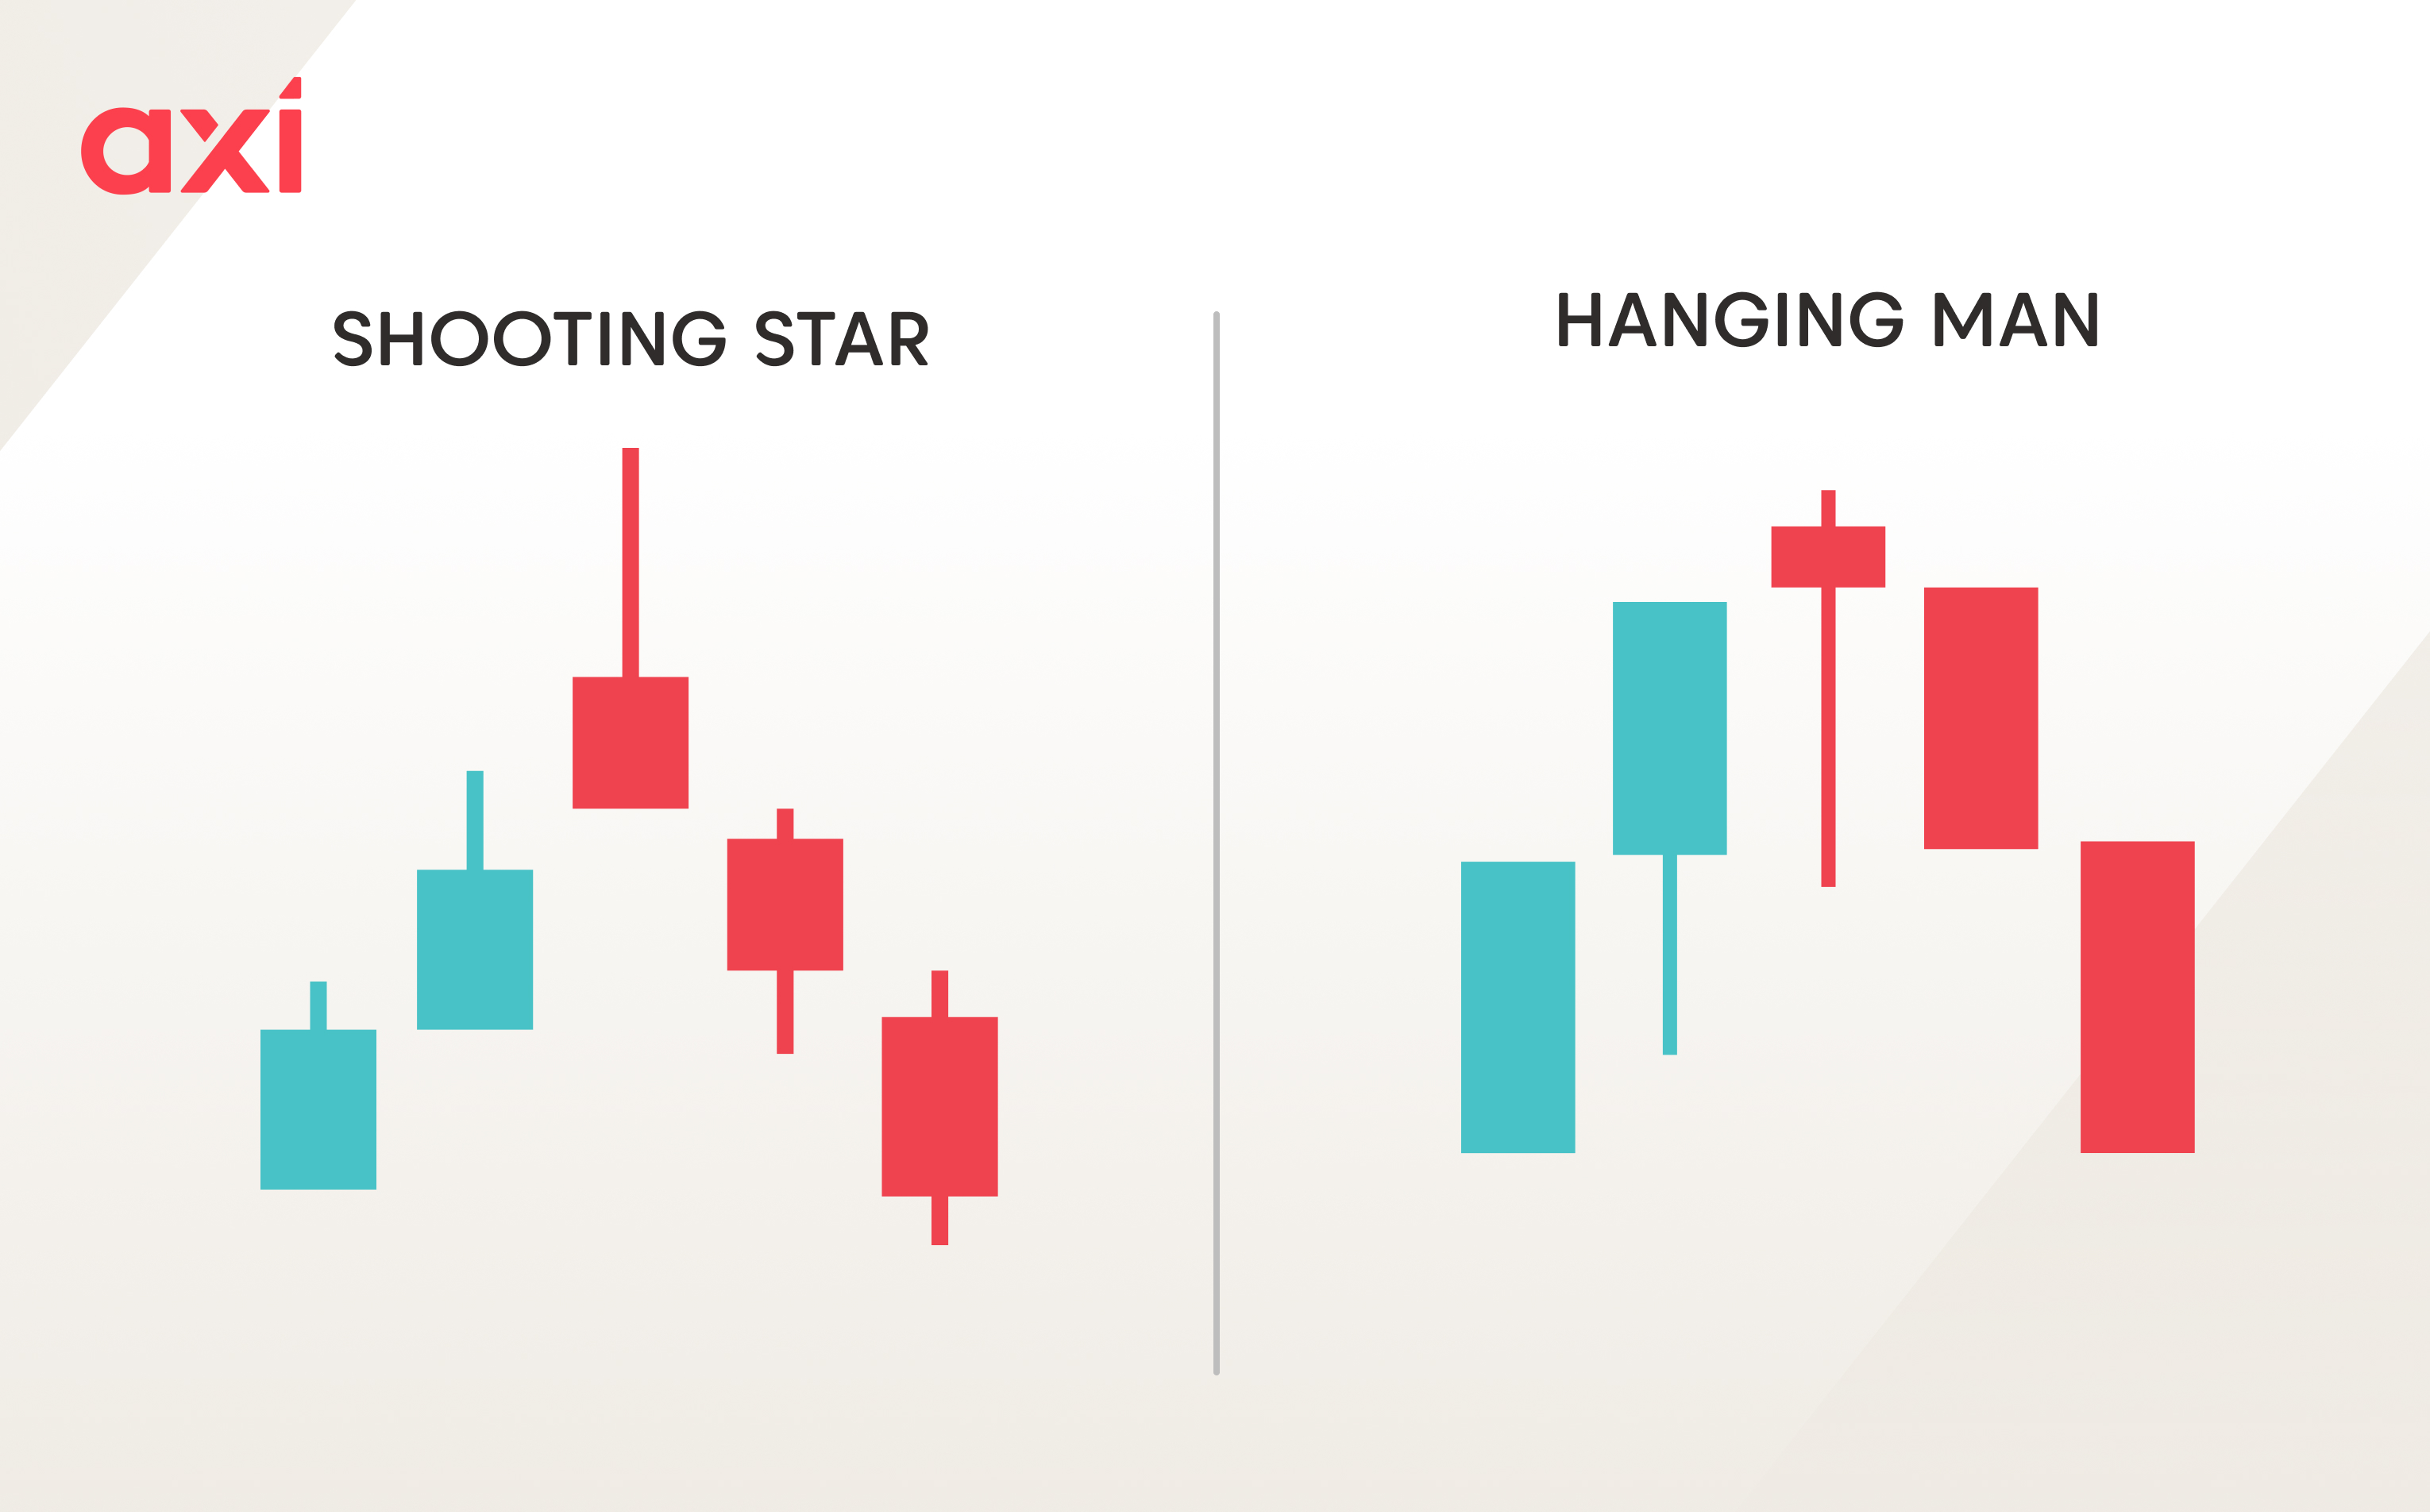
Again, both candles appear during an uptrend and signal a bearish reversal. However, the hanging man's body is located at the upper range of the candle and has a long lower shadow, as well as little or no upper shadow. The hanging man looks like a hammer, while the shooting star looks like an inverted hammer.
These two candlestick patterns look almost identical, but the context is important. The shooting star emerges during an uptrend and signals a bearish reversal, while the inverted hammer occurs during a downtrend and signals a bullish reversal. Ideally, a shooting star is represented by a red candle, while an inverted hammer is depicted by a green candle - though this is not a strict requirement for the signal to be considered valid.
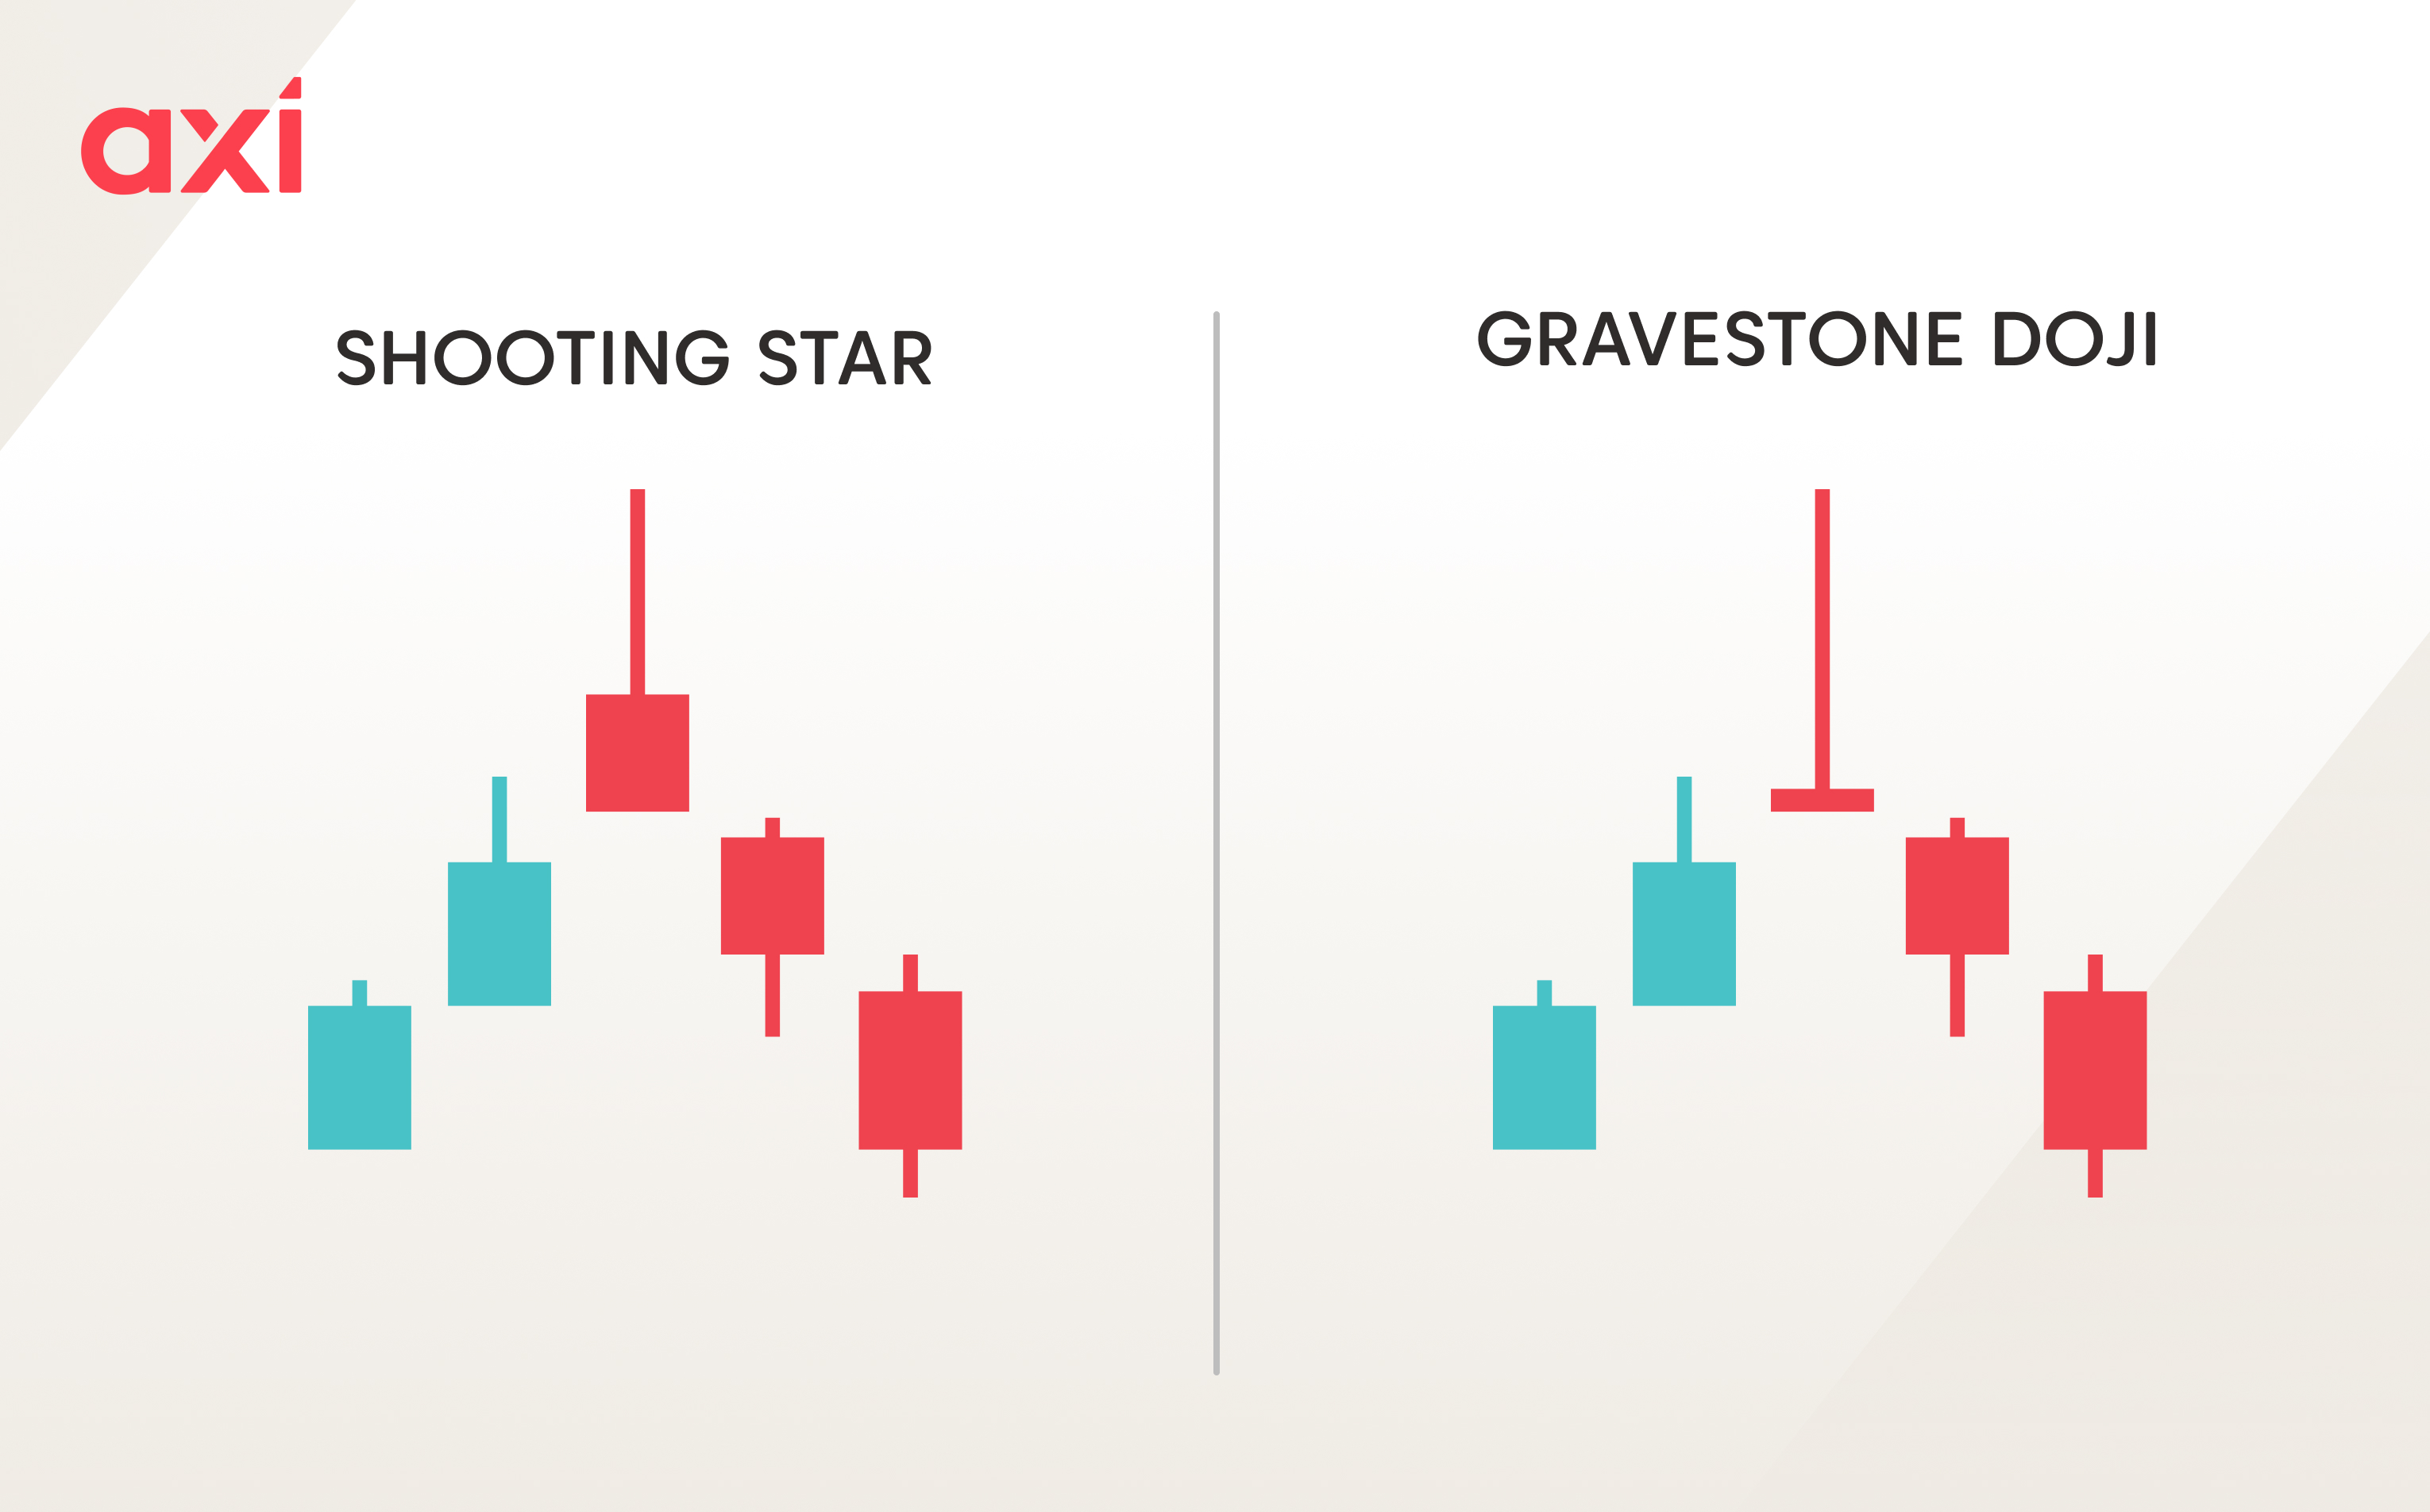
The gravestone doji is another candlestick pattern that can look like the shooting star. Both materialise during an uptrend and indicate a bearish reversal. The key difference between them is the presence of a real body: the shooting star has a small real body, while the gravestone doji either lacks one entirely or has a negligible one.
A shooting star is a candlestick pattern that appears during uptrends and signals a bearish reversal. The candle itself has a small body located near the lower end of the candle and a long upper shadow, which is at least twice the size of the body. It has no or a very small lower shadow.
As with any candlestick pattern, it is important to wait for a confirmation before entering a trade, which comes in the form of the subsequent candle being a bearish one that closes below the body of the shooting star. A shooting star can appear on any timeframe.
Ready to trade your edge?
Join thousands of traders and trade CFDs on forex, shares, indices, and commodities!
This information is not to be construed as a recommendation; or an offer to buy or sell; or the solicitation of an offer to buy or sell any security, financial product, or instrument; or to participate in any trading strategy. It has been prepared without taking your objectives, financial situation and needs into account. Any references to past performance and forecasts are not reliable indicators of future results. Axi makes no representation and assumes no liability with regard to the accuracy and completeness of the content in this publication. Readers should seek their own advice.
FAQ
A shooting star is a bearish candlestick pattern that appears during an uptrend and signals a trend reversal.
It shows that buyers were able to push the price higher initially, but they lost control, and sellers were able to force the price significantly lower.
It is important to wait for confirmation, which comes in the form of the subsequent candlestick being a bearish one that closes below the body of the shooting star.
As with any candlestick pattern, it is important to wait for confirmation prior to entering a trade. Even then, false signals can occur, which is why placing stop-loss orders is crucial.
Not necessarily, but a red shooting star is preferred, as it is a stronger signal.
When trading the shooting star, certain technical indicators can be particularly helpful in confirming potential bearish reversals. For example, the RSI or MACD are often used to identify overbought conditions.

