
Login with email
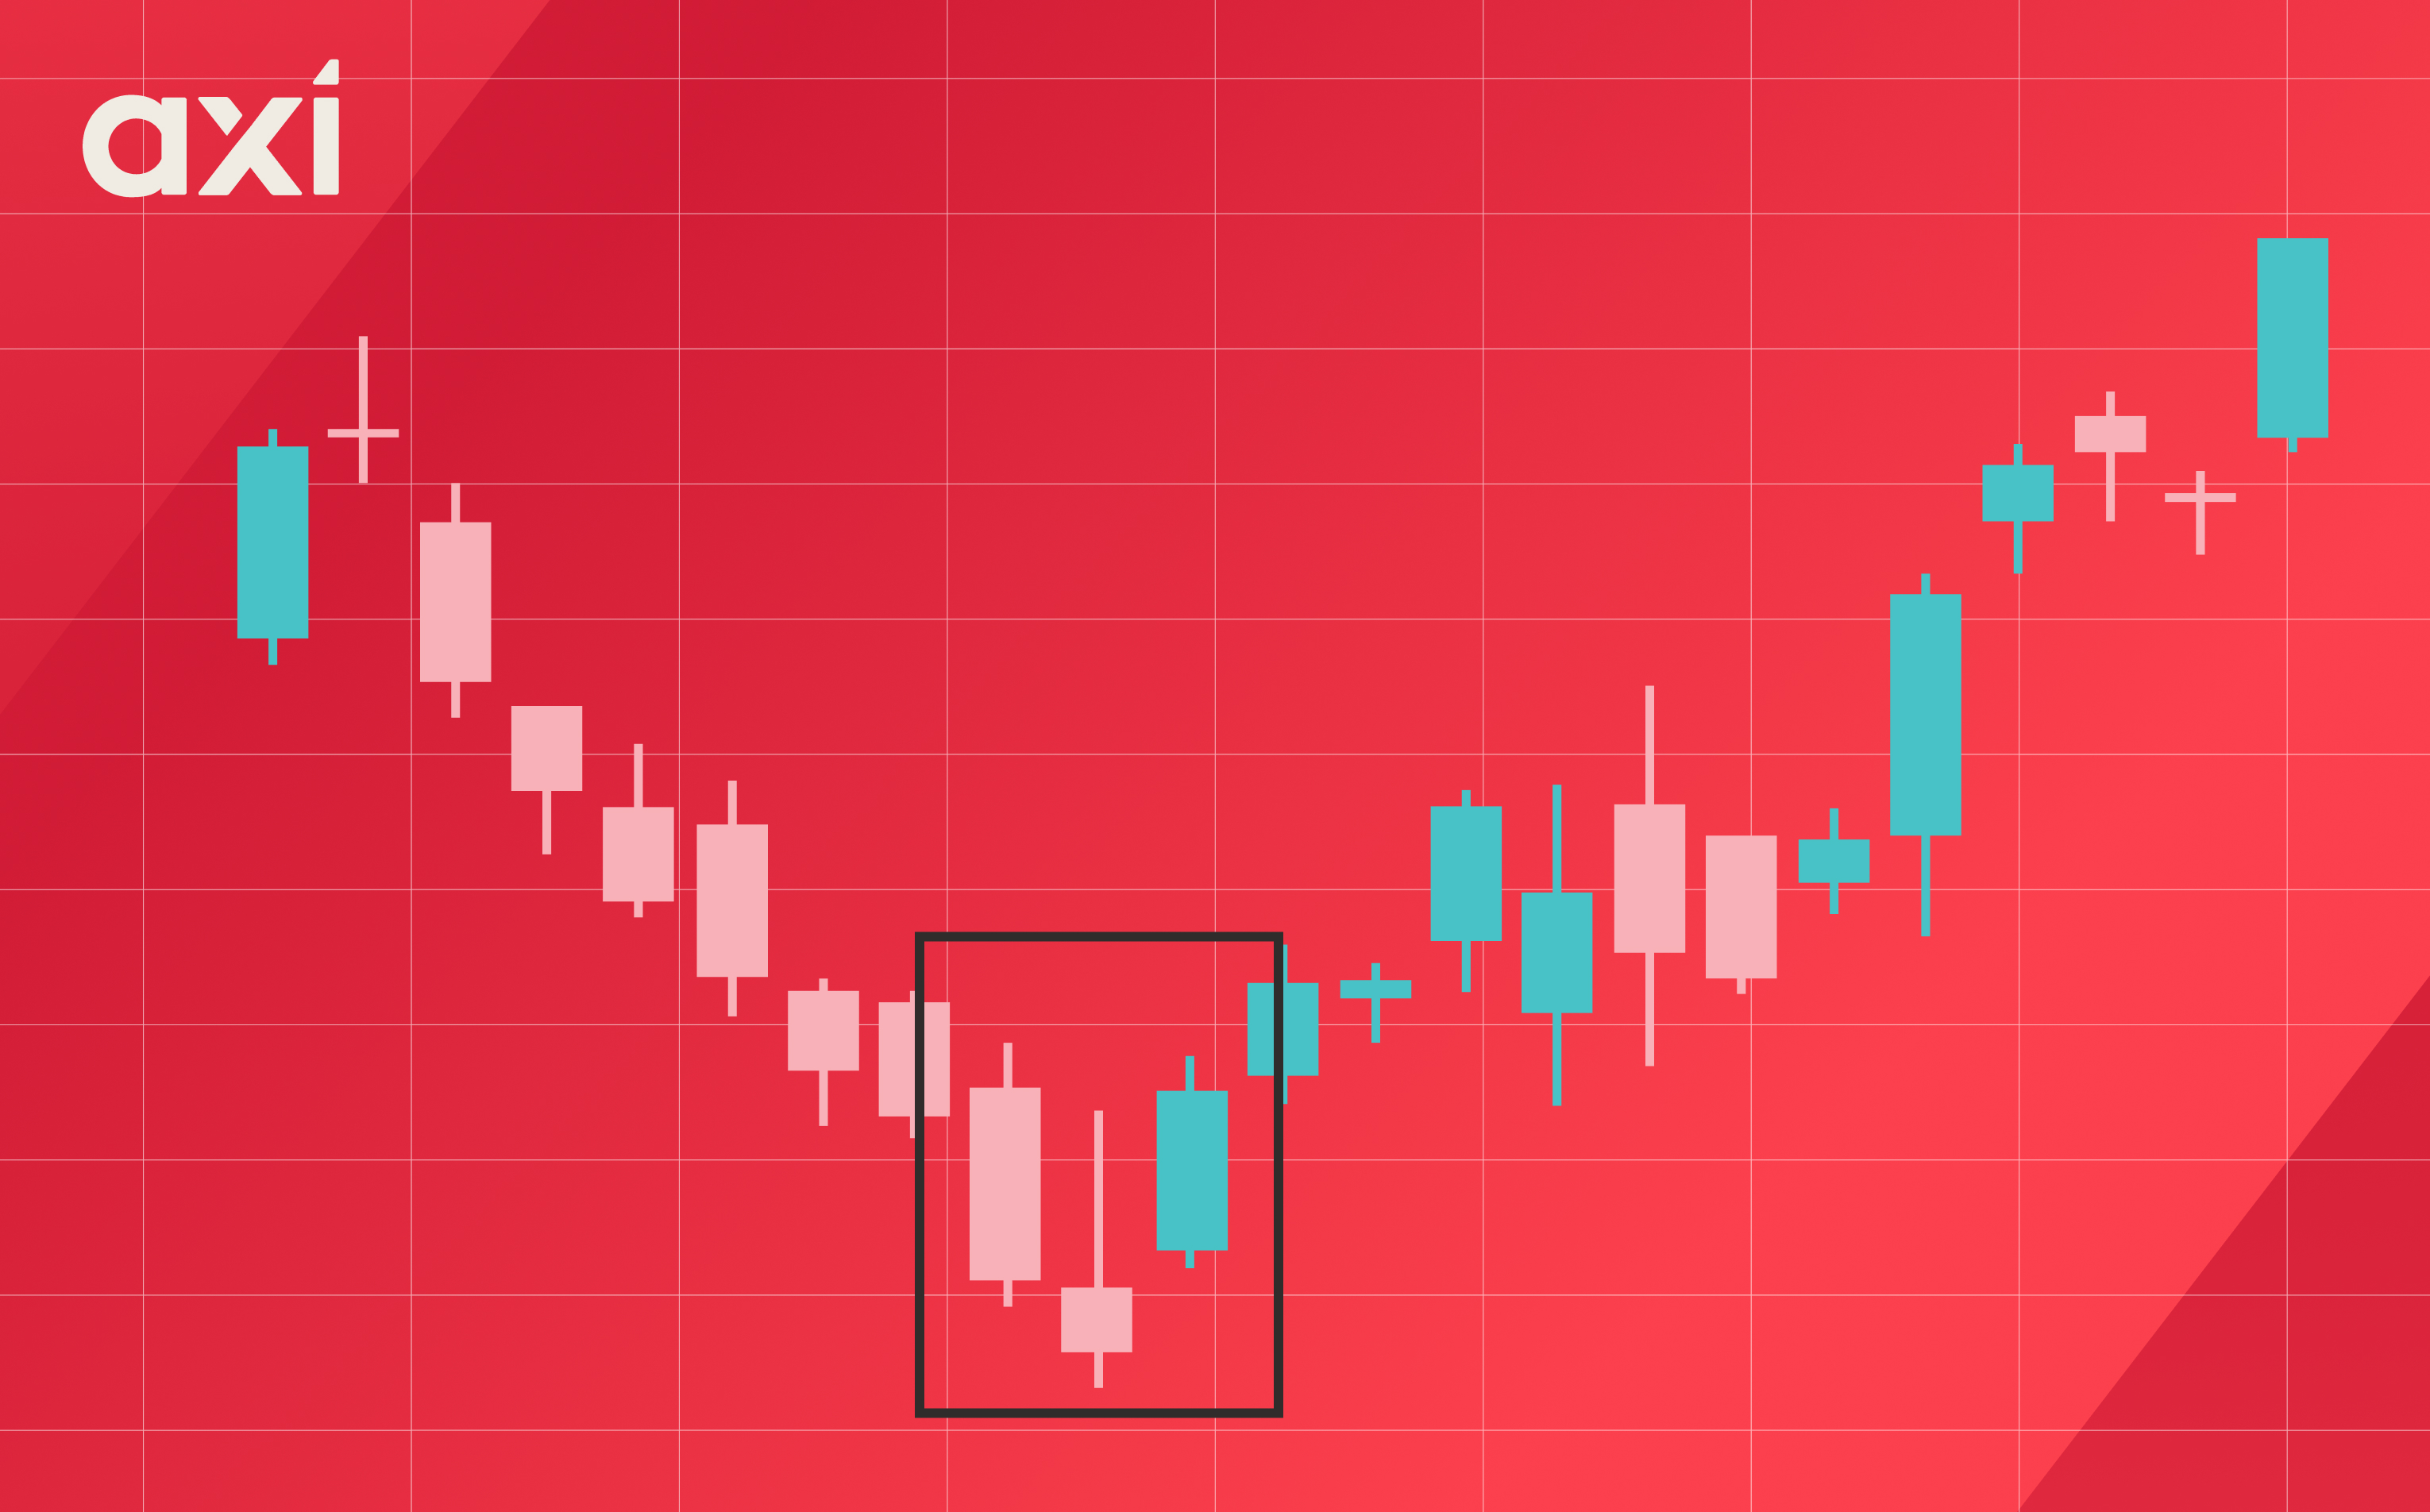
A morning star is a bullish candlestick pattern that emerges during a downtrend, signalling a potential bullish reversal. This pattern occurs fairly frequently and can be identified on charts across all timeframes. Its straightforward structure makes the morning star relatively easy to recognise, and it’s considered one of the more popular candlestick patterns.
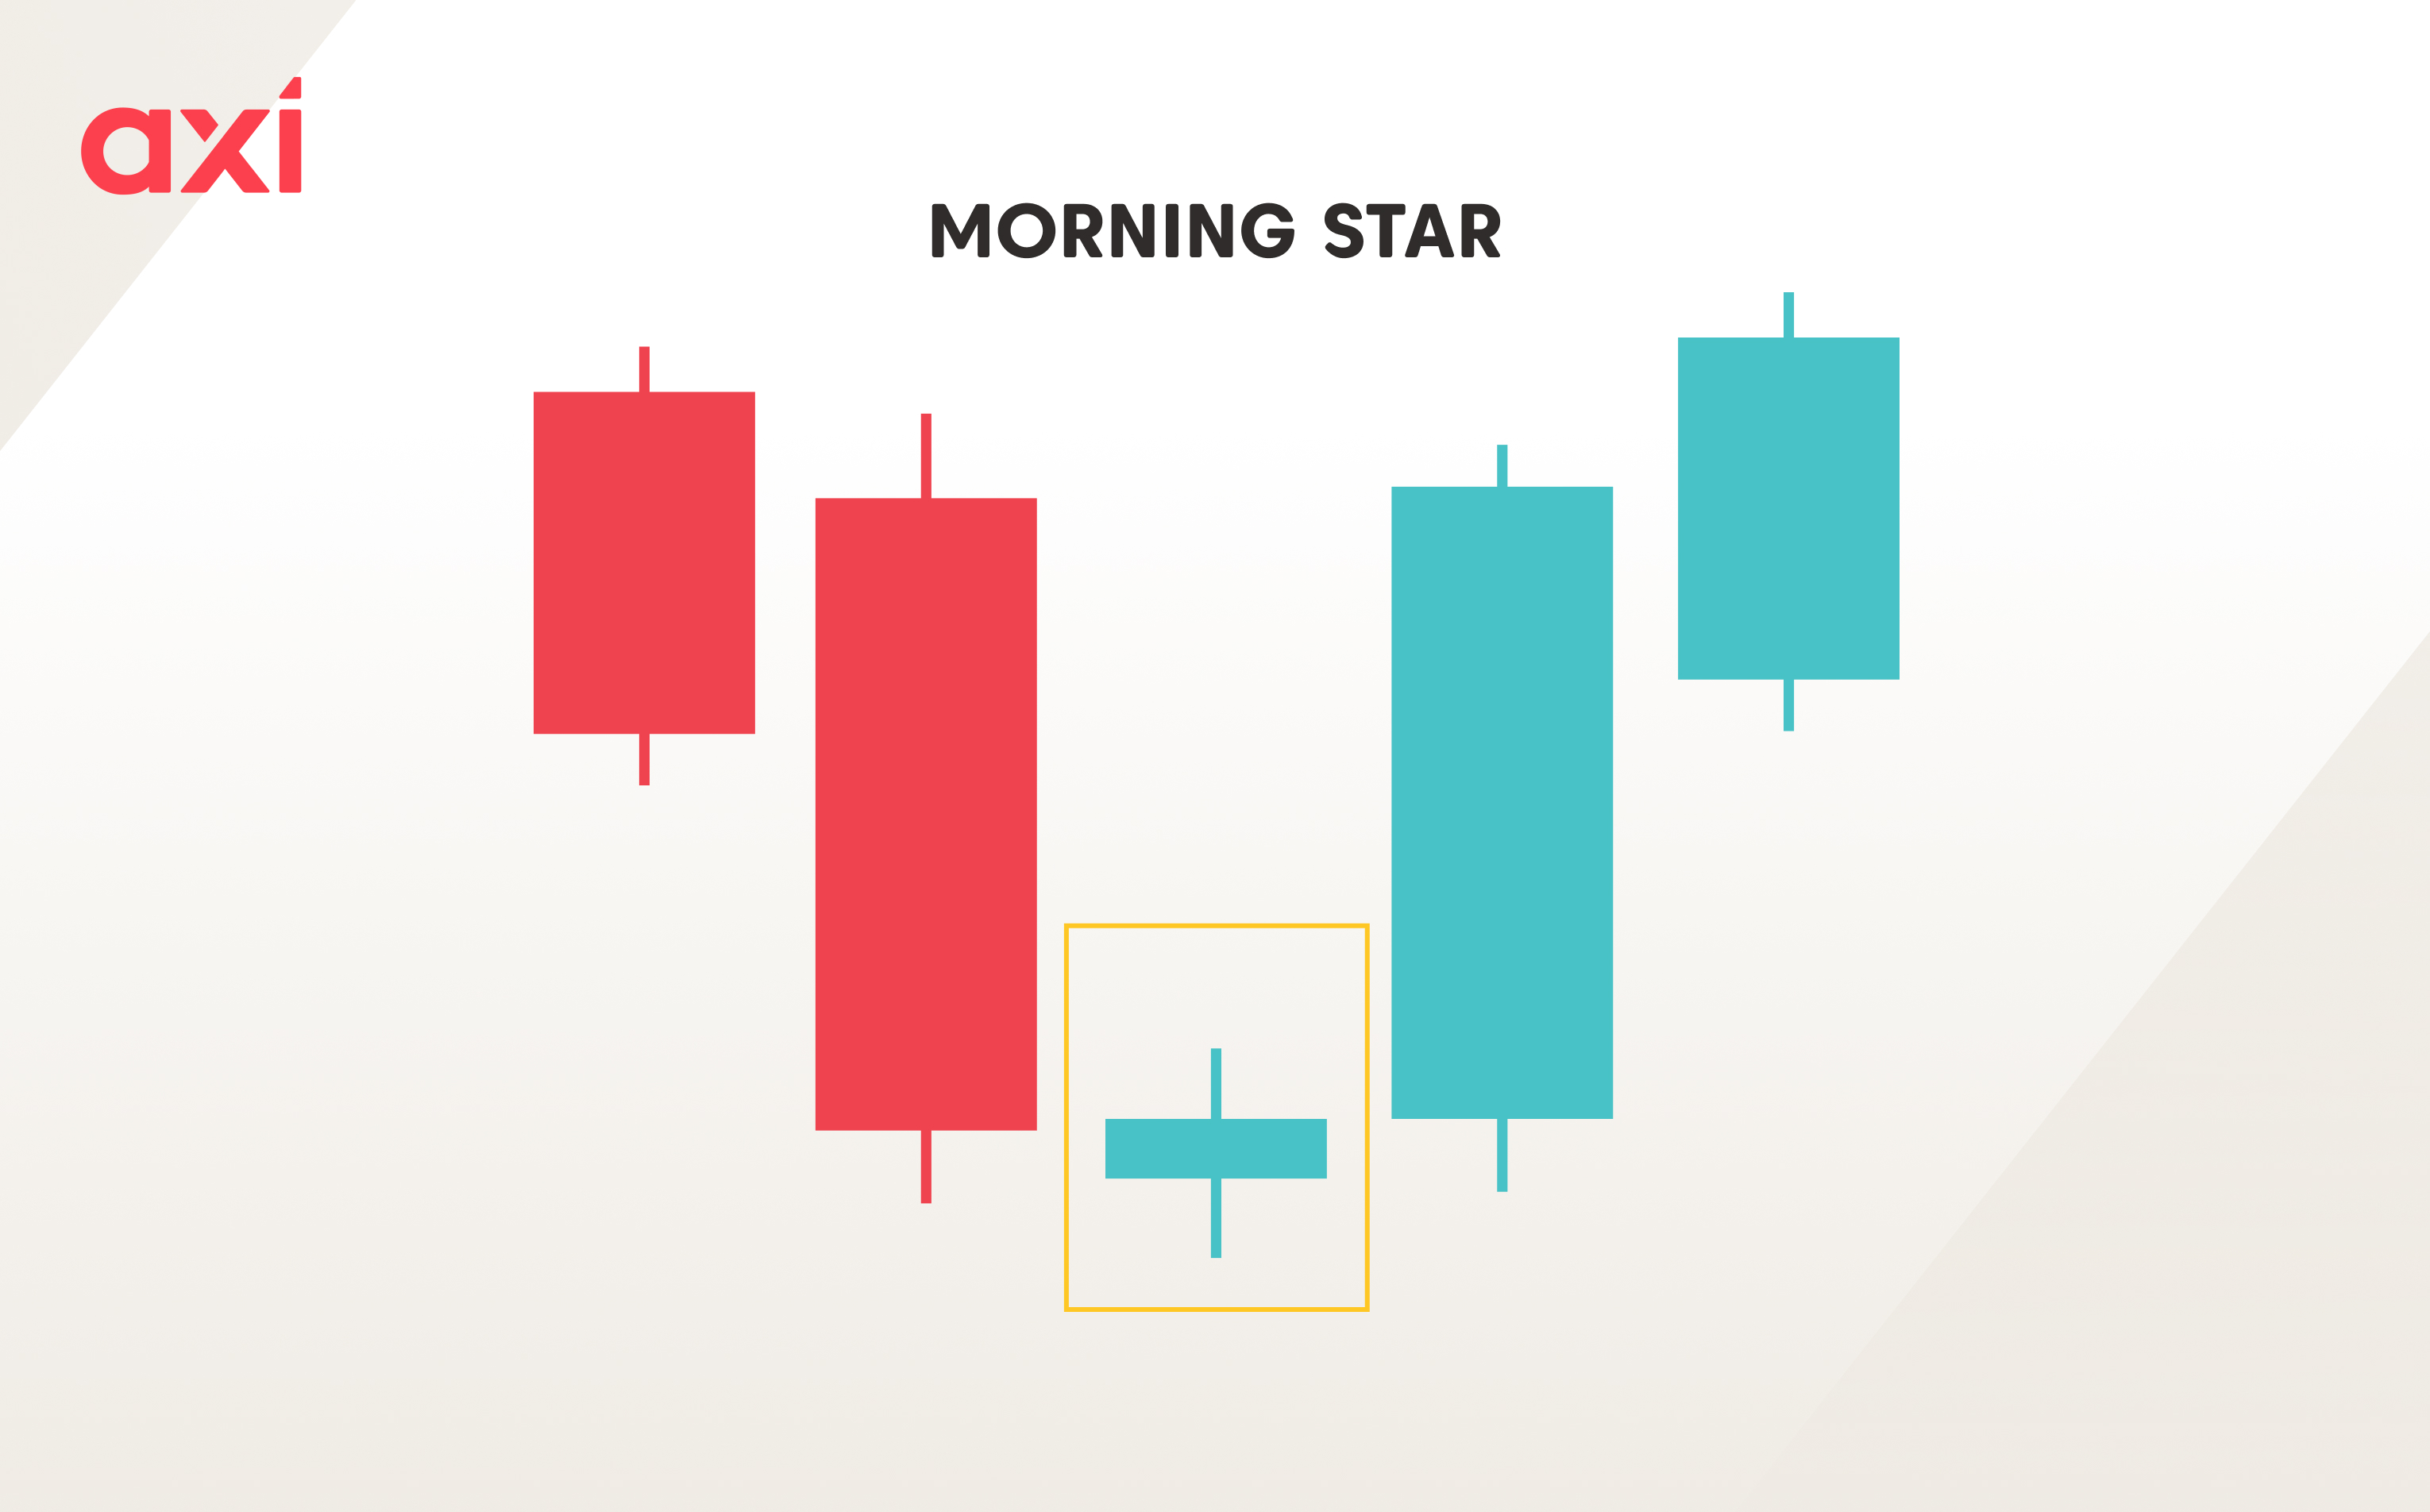
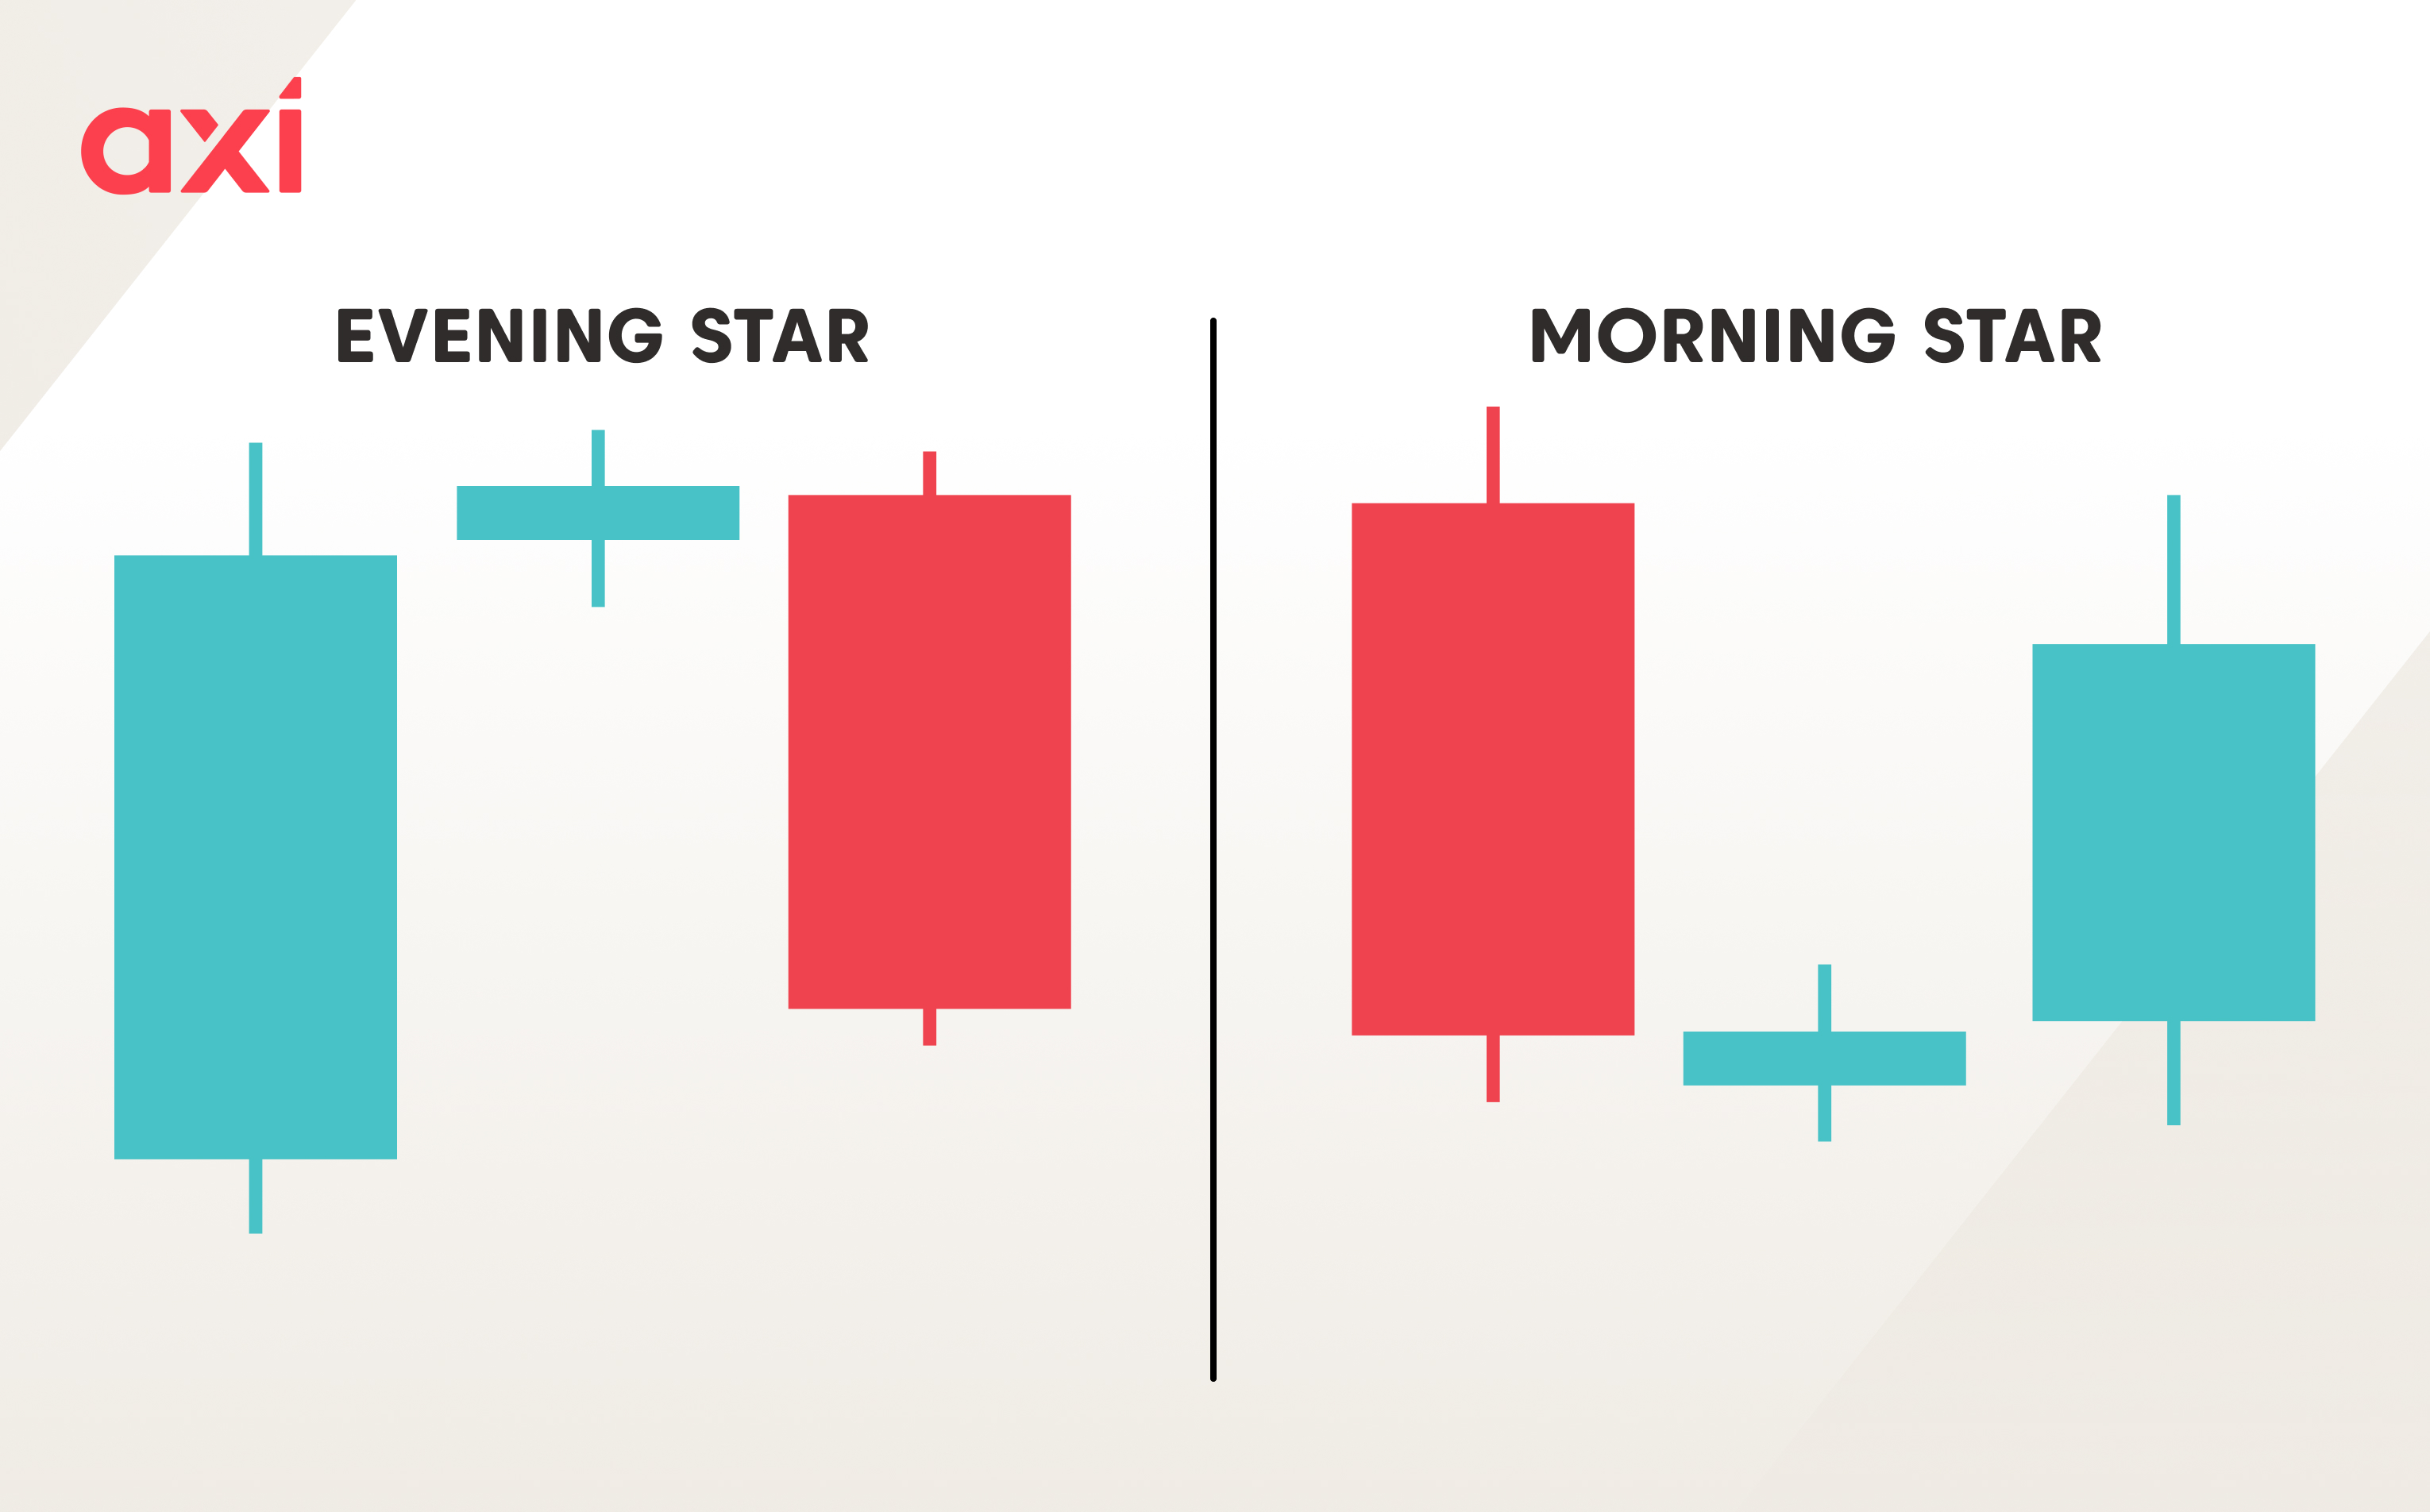
The morning star consists of three candles:
As with every candlestick pattern, the morning star tells us a story about price action and market sentiment.
The first candlestick indicates that bears are still in control and that selling pressure remains strong.
The second candlestick indicates that the bearish momentum has dissipated, and there is a struggle between bulls and bears, with no clear winner.
The third candlestick illustrates that bulls have taken control, and the strong upward momentum suggests a potential bullish trend reversal.
The morning star candlestick can be a reliable bullish reversal signal, provided it appears during an established downtrend. To increase confidence in the signal, it’s important to wait for confirmation and use supporting technical tools.
Furthermore, for the pattern to be considered valid, the third bullish candle should ideally close above the real body of the first bearish candle.
An additional positive factor would be the pattern’s appearance near a key support level, as this confluence further strengthens the likelihood of a bullish reversal.
Before trading a morning star, ensure that the instrument is in an established downtrend. Trading morning stars during weak downtrends or ranging markets significantly increases the risk of false signals.
Once you have spotted the morning star, you can verify whether the pattern has emerged near a significant support level and consider the signals from technical indicators. For example, if the Relative Strength Index (RSI) indicates heavily oversold conditions, it would improve the odds of a bullish reversal.
While a morning star in a strong downtrend with supporting signals like nearby support or oversold RSI can strengthen the bullish case, these additional steps aren't mandatory. However, given the pattern's frequency, using such filters helps prioritise higher-probability trades and reduce false signals.
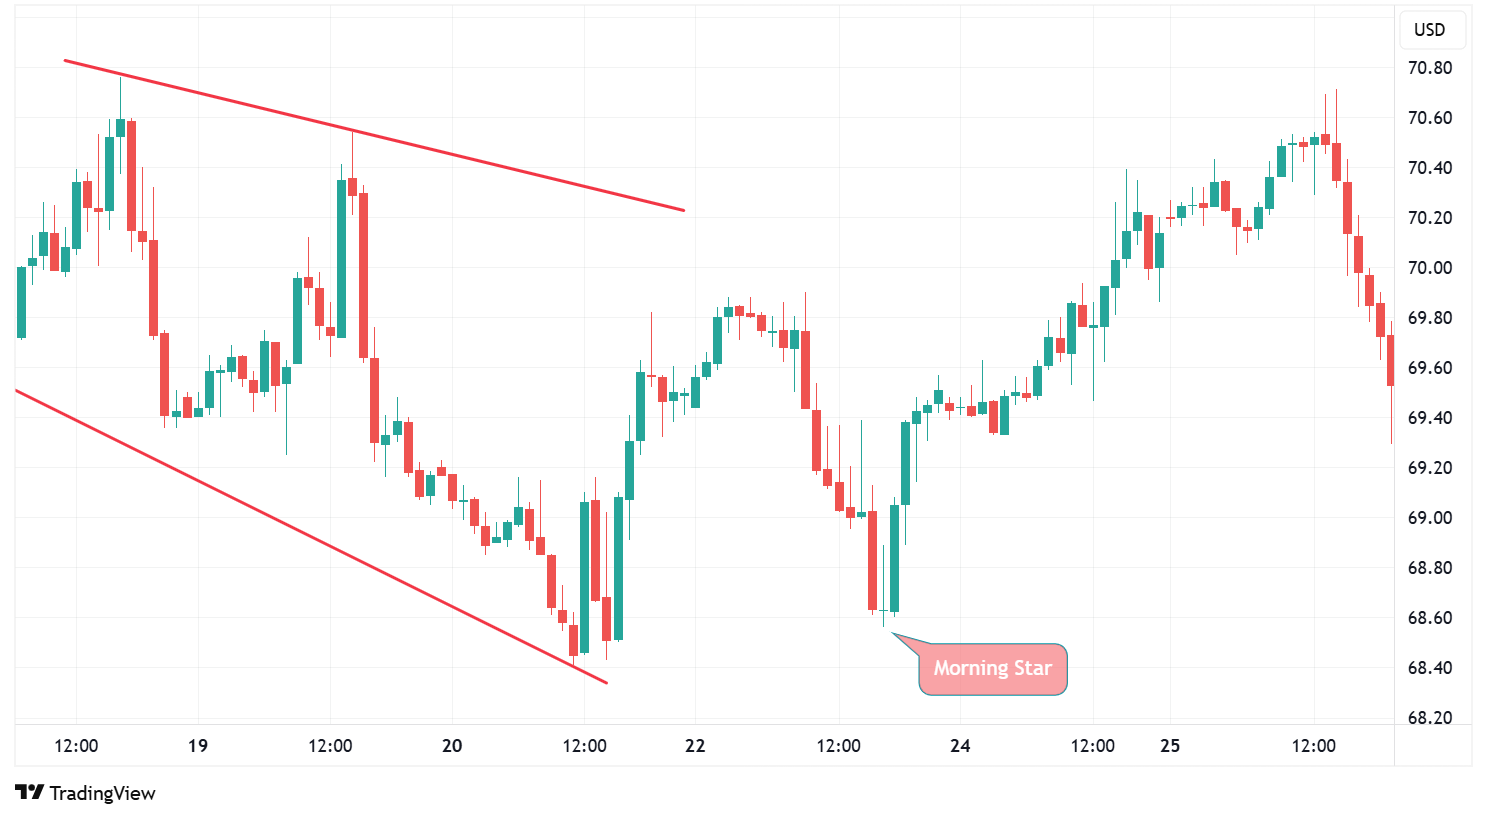
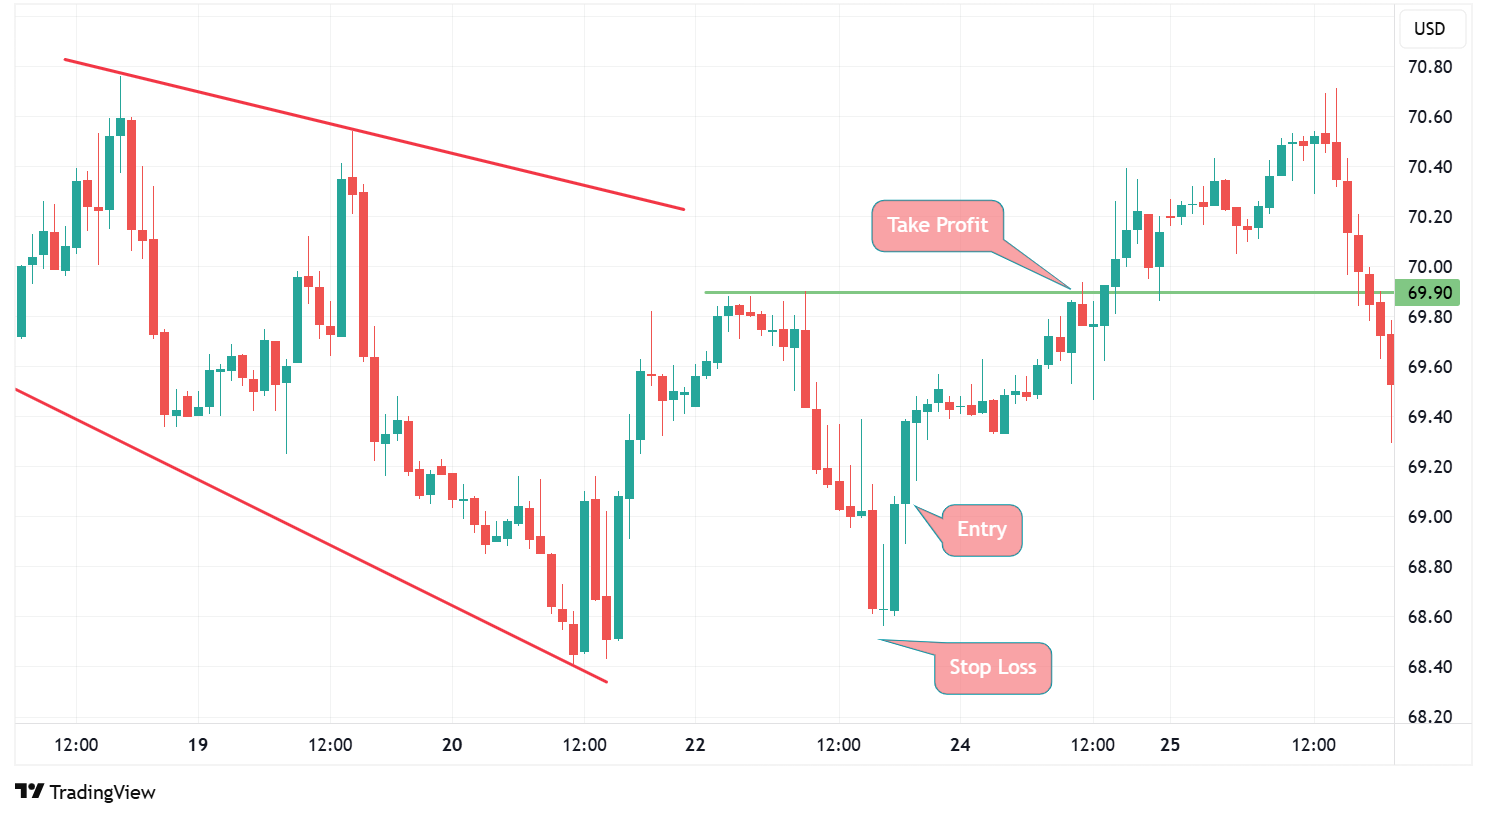
Most traders will buy on the close of the third candle. Waiting for the candle to close is crucial, as it confirms the pattern.
The stop-loss orders are typically placed just below the low of the second candle. Meanwhile, the pattern fails to provide a clear indication of the optimal take-profit location. Traders will generally use classic resistance levels or Fibonacci retracement levels to determine where to exit.
While both patterns consist of three candles, the morning star appears during a downtrend and signals a bullish reversal, while the evening star appears during an uptrend and signals a bearish reversal.
The hanging man consists of only one single candlestick instead of three. Also, it appears during an uptrend and signals a bearish reversal.
Both the morning star and inverted hammer are bullish reversal patterns. However, the inverted hammer consists of only one candlestick, which has a small body located near the bottom of the candle and a long upper shadow plus little or no lower shadow.
Unlike the morning star, the gravestone is a bearish reversal signal. It forms at the peak of an uptrend and consists of only one candlestick, although traders often look for a subsequent bearish candle after the gravestone doji forms to validate the reversal.
The morning star is a bullish candlestick pattern that appears during a downtrend and indicates a bullish reversal. The pattern consists of three candlesticks — the first one being a bearish one, the second a neutral one, and the third a bullish one.
The morning star appears fairly frequently, which is why it is important to ensure the instrument traded is in an existing downtrend and to use additional tools to improve accuracy.
Ready to trade your edge?
Join thousands of traders and trade CFDs on forex, shares, indices, and commodities!
This information is not to be construed as a recommendation; or an offer to buy or sell; or the solicitation of an offer to buy or sell any security, financial product, or instrument; or to participate in any trading strategy. It has been prepared without taking your objectives, financial situation and needs into account. Any references to past performance and forecasts are not reliable indicators of future results. Axi makes no representation and assumes no liability with regard to the accuracy and completeness of the content in this publication. Readers should seek their own advice.
FAQ
The morning star is a candlestick pattern that appears during a downtrend and signals a bullish reversal.
It consists of three candles—a long bearish candle, followed by a neutral candle with a small body and a long bullish candle.
Yes, the morning star can appear on all chart timeframes.
A third candle, which is strong and bullish and closes above the body of the first bearish candle.
Yes, traders often use technical indicators when trading the morning star, particularly the MACD and RSI.

