Best trading indicators: A list of the 17 most used technical indicators

Technical analysis is a broad term we use when we’re examining market data to try and predict future price trends. An important part of any trader's technical strategy is the use of technical indicators.
We can use a variety of trading indicators and continuation and reversal patterns to hone in on our speculation of where the price of an asset may go.
Technical analysis is used in many aspects of financial investment but is commonly applied to markets like forex, shares, indices, commodities, and cryptocurrency. To be able to understand price action, you first need to learn basic trade signals and utilise a trading platform with the best indicators for trading built into the system.
Table of contents
- How do I start technical analysis?
- What are trading indicators?
- How do technical indicators work?
- What are the best technical indicators?
- 1. Moving average (MA)
- 2. Exponential moving average (EMA)
- 3. Moving Average Convergence Divergence (MACD)
- 4. Relative Strength Index (RSI)
- 5. Percentage Price Oscillator (PPO)
- 6. Parabolic SAR
- 7. Average directional index
- 8. Stochastic oscillator
- 9. Bollinger bands
- 10. Standard deviation
- 11. Fibonacci retracement
- 12. Williams Percent Range (%R)
- 13. Commodity Channel Index (CCI)
- 14. Ichimoku cloud
- 15. On-Balance volume (OBV)
- 16. Accumulation/Distribution line
- 17. Aroon indicator
- What technical indicators should I learn first?
- How many trading indicators should I have on my charts?
How do I start learning technical analysis?
To conduct proper technical analysis and examine a financial trading instrument – like a currency pair or commodity – you'll need some type of charting software with built-in tools like data displays, drawing functions, and mathematical calculations (such as moving averages or Fibonacci retracements). At Axi, we provide the MetaTrader 4 trading platform which gives you access to all the functionality needed to learn technical analysis.
You’ll also need access to historical data. This can be obtained through the MT4 trading platform, and on sites like Quandl or Yahoo Finance.
What are trading indicators?
Technical indicators are mathematical calculations – or can even be something as simple as a trendline – that allow traders to identify when an asset is experiencing overbought or oversold conditions. It uses historic price, volume, and open interest information to forecast what direction the financial asset is going. This underlying knowledge can help a trader identify trading opportunities.
Throughout this article, we’ll examine some of the best technical indicators utilised by traders worldwide, and their definitions so you can take advantage of these techniques when conducting technical analysis. But first, let's deep dive into exactly how technical indicators work.

How do technical indicators work?
The simple answer is that they don't actually ‘work’ at all! What they are is a measure of the market's psychology. They simply show what the price has done in relation to previous prices, so can be used as guidelines for traders. In combination with candlestick patterns, these two tools can help set up your technical analysis strategy.
For example, an indicator can be used to show where to place a stop-loss order when it comes time to close a trade to mitigate risk.
Since they are purely data-driven, technical indicators are particularly useful if you prefer to not have emotions involved in your trading decisions, or believe someone else’s opinion might sway your decisions in a particular situation.
One way trading indicators do work though is through trendlines, which allow traders to see whether an asset is trending upwards or downwards, thus saving them from timing errors with trades.
What are the two basic types of technical indicators?
The two basic types of technical indicators are overlay indicators and oscillator indicators.
What is an overlay indicator?
An overlay indicator is a basic trading and technical analysis technique that involves overlaying one trend onto another. In the case of an overlay on a chart, this simply means displaying two lines with different colours on a chart so they both remain visible.
What is an oscillator indicator?
An oscillator indicator measures the distance between two points on a technical analysis graph in order to track momentum (or lack thereof). The most common type of oscillating indicator, though not necessarily the simplest, is a moving average. These are used to figure out where new high prices may be possible for an instrument, based on past highs.
This helps traders determine when they should buy or sell so they can make more accurate decisions about when these assets will have increased in value before current trends reverse themselves (a concept known as "support" and "resistance").
There are two common oscillator indicators:
Leading indicators
The leading indicator measures current market conditions to provide an indication of what is likely to happen next. Leading indicators are typically used in conjunction with lagging indicators.
Lagging indicators
Lagging indicators are measurements based on recent history and they include the moving average (MA), exponential moving average (EMA), and Moving Average Convergence Divergence (MACD).
When used together, these two oscillators give a more accurate reading of market sentiment and help to better predict potential price movements.
What are the best technical indicators?
A current list of the best trading indicators can be found below. It’s worth taking some time to discover how each of these important indicators works and how they can be used within your market analysis and trading strategies.
List of the best technical indicators
1. Moving Average Indicator (MA)
The moving average indicator is one of the most popular technical indicators and it's used to identify a price trend in the market. For example, if the short-term MA crosses over the long-term MA, this is an indication that there might be an upward trend coming up in the future. Another common area where the moving average indicator is used by traders is to identify the trend reversal level.
There are many different types of moving averages, and some traders use more than one to confirm their signals. Some examples include simple moving averages, exponential (more weight given to recent numbers), or weighted (giving each day in the lookback period equal importance).

2. Exponential Moving Average Indicator (EMA)
The exponential moving average indicator differs from other types of MAs because, instead of having one set period (e.g. 20 periods), the EMA has two different time intervals that are used to calculate its value. For example, if you have an EMA with a 50/100 moving average calculation, the first point used to calculate the EMA will be 50 points away from the current price, plus 100 periods previous.

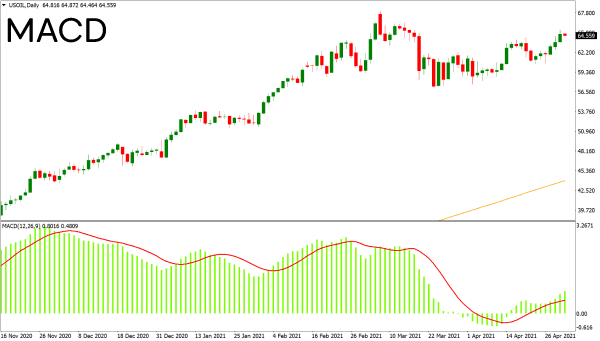
3. Moving Average Convergence Divergence (MACD)
The MACD is a technical momentum oscillator that plots two exponential moving averages, one of which has been subtracted from the other to create a signal line or "divergence" (MACD Line) and then added back to it (signal). There are three main parameters - Signal length, Moving average convergence/divergences frequency, and Periodicity. By default, these values are 12, 26, and 20 respectively. The longer the duration on each MA gives more weighting but also decreases sensitivity because with increasing time there will be fewer periods during which change can occur.
4. Relative Strength Index (RSI)
The Relative Strength Index (RSI) is a technical momentum indicator that compares the magnitude of recent gains and losses over time and then plots them as an oscillator. The RSI was developed in 1978 and has since become one of the most popular oscillator indicators.

5. Percentage Price Oscillator indicator (PPO)
The percentage price oscillator is a technical momentum indicator that plots the difference between two moving averages, where one of these lines has been shifted by an amount proportional to gains on stock. When plotting the PPO it starts with an initial value of 50%, then fluctuates above and below this level according to market volatility.
6. Parabolic SAR indicator (PSAR)
The parabolic SAR is a popular indicator used in technical analysis to determine the price at which momentum has changed. The Parabolic SAR can be seen as an improvement on traditional moving average crossover systems because of its more intuitive approach to determining signal changes. A PSAR buy/sell cross occurs when the current closing price crosses above or below the Purchase Price (P-S) line; instruments are bought when they break out from prices that have been trading inside a trend channel, while sell signals occur with the instrument breaking through support levels.

7. Average Directional Index (ADX)
The ADX is a trend-following indicator that measures the strength or weakness of a stock's price movements. The larger the value, the stronger the trend – and vice versa for smaller values. The ADX is a very popular indicator and is often used in conjunction with other indicators to create trading systems.

8. Stochastic Oscillator Indicator
The Stochastic Oscillator is a momentum indicator that compares prices to ranges of values over time. The oscillator consists of two lines: the %K line and the %D line.
The %K line measures how close price action moves toward its high point (known as K), while the %D line measures how close price action moves toward its low point (known as D). When both lines are above their centrelines, this indicates an asset or stock has reached a “buy zone”; when both lines are below their centrelines, it signals a “sell zone.”

9. Bollinger Bands Indicators
Bollinger Bands are a set of three lines that represent volatility, which is the range in prices that they have historically traded within.
The two outer lines show where upper and lower levels of price movement should be expected to trade 90% of the time (the trading band) while the middle line shows real-time price action moving between those bounds as it fluctuates day-to-day. When these bands contract (shrink), this indicates low volatility; when these bands expand, this suggests high volatility may be present in an asset or stock market index.

10. Standard Deviation Indicator
Standard deviation is a statistical measure of how prices are dispersed around the average price. The greater the standard deviation relative to average volatility in an asset or stock market index, the larger the fluctuations in pricing from day to day (extreme swings).

11. Fibonacci Retracement Indicators
Fibonacci retracement indicators are created by taking two extreme points (usually the peak and trough), dividing that distance by a Fibonacci number – such as 0.618 or 23.62% – then drawing an impulse line from each of those points in turn to where the price is now. This helps traders identify areas where buyers may be accumulating with heavy buying pressure after the price has fallen through support levels and key reversal zones that can signal potential reversals.
Find out more about Fibonacci retracement levels and how you can utilise them in your trading.

What’s the difference between Fibonacci retracement and extension?
A Fibonacci extension is a continuation pattern, while a Fibonacci retracement can be either. The main difference between the two is that when a Fibonacci extension breaks from a trend line it tends to extend its previous move, whereas when breaking from a trendline during a Fibo retracement it will reverse back in the opposite direction.
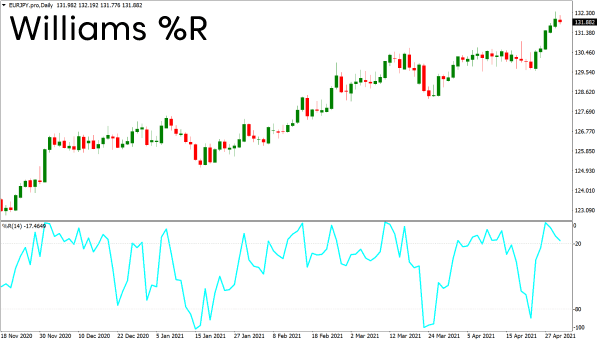
12. Williams Percent Range (%R)
The Williams Percent Range is a volatility indicator that charts the magnitude of recent price action. It's calculated by subtracting the low from the high, and then dividing it by two (the result will be between 0-100%). A significant reading would suggest an oversold or overbought condition that may signal a reversal in trend direction on either side of zero.
Typically when using this indicator, traders want to see values above 70% as signals for trends toward buy positions while readings below 30% represent conditions where sell orders are more likely to succeed.
13. Commodity Channel Index (CCI)
The Commodity Channel Index is a market breadth indicator, used to identify whether upward or downward trends in commodity futures prices are more dominant on any given day. It’s calculated by subtracting the low from the high and dividing it by two (the result will be between -100% and +100%).
If CCI values are positive, bulls are stronger than bears if they exceed 50%. The opposite applies when values fall below 0, meaning bears prevail as long as readings stay below 50%. Values above 100% represent overbought conditions while those under -100%, indicate an oversold condition. Trades should be avoided at such extremes since both markets would have to reverse course in order for a long-term trade to work.

14. Ichimoku cloud indicator
The Ichimoku Cloud indicator is created by drawing four lines. The first line is the "tenkan-sen" (base of support), followed by a "kijun-sen" that acts as an extension of resistance to form a trading channel. Below this are two more moving averages – the Ichimoku's lagging and leading indicators respectively. Together they create the Ichimoku Cloud.
Learn more about the Ichimoku Cloud strategy and utilise it on your trading charts.

15. On-Balance Volume Indicator (OBV)
OBV is a volume-based indicator that measures the cumulative trading activity from buyers and sellers. A buy OBV will rise as more traders enter into long positions, while a sell OBV rises with each new trader taking on short positions.

16. Accumulation/Distribution Line Indicator (A/D)
The A/D line is a momentum oscillator that measures the relationship of trading volume to price changes. One way to use this indicator would be to identify the divergence between AD and prices, which can signal an impending reversal in trend. An example is when there are more declining periods than rising periods (more red bars than green), which could indicate oversold conditions; the opposite holds true if the bars are mostly green.

17. Aroon Oscillator (AO)
The Aroon oscillator is an indicator that measures the momentum and direction of a trend in relation to price levels. When prices are rising, AO also rises; when prices fall, it falls. The difference between these two lines indicates whether there is overbought (a positive number) or oversold (a negative number).
What technical indicator should I learn first?
Many new traders want to know what technical indicator they should learn first. The truth is that different indicators can be used for different situations, and if you're just starting out it can be hard to figure out which one is the best for you.
However, a very useful starting point is a moving average, such as the 50-day moving average (provided it's not an overly smoothed one). In general terms, you’ll want to buy when the MA crosses above its SMA line and sell when it falls below its own MA lines. These rules can also be applied to short-term charts because they act as support/resistance points for broader trends.
A 50-day EMA is the most common and popular type of moving average to use, mainly because it's long enough to filter out any short-term noise but still offers a glimpse into near-term price action. Many traders use this as their first indicator when entering trades on a daily timeframe and also for setting stop losses. The logic behind using an MA in this way is that if you're unsure whether prices are trending up or down, looking at an MA can help clear things up by showing where support/resistance levels might be based on past performance.
What are the best technical analysis indicators for day traders?
The best technical indicators for day trading are the RSI, Williams Percent Range, and MACD. These measurements show overbought and oversold levels on a chart and can help predict where a price is likely to go next, based on past performance. However, they're not always accurate so it's important to use them in conjunction with other indicators if you want a higher level of accuracy when finding trading signals.
What are the best forex trading indicators?
The best technical indicators for forex traders are the RSI, MACD, and Bollinger Bands. Most FX traders use these as their primary indicators. There are other indicators available in the market, but these three tend to be the most commonly used for predicting future price points.
How can forex traders utilise technical indicators and fundamental analysis?
The best way for forex traders to use technical indicators and fundamental analysis is by looking at price charts utilising indicators in conjunction with each other.
A trader might forecast future price movements by looking at an indicator and then checking to see if that prediction matches up with what's happening on the fundamental side of things. Forex traders also use popular indicators as a way to confirm their own predictions before taking any trades, which they may not be able to do when using just fundamentals alone.
How many indicators should I have on my charts?
There is no clear answer to that question, as it depends on the trading style and the strategy. However, an overload of technical indicators can lead to confusion and a messy trading strategy.
When there are too many indicators on a chart, the trader may receive conflicting signals which can cause them to become nervous and unsure about whether following the strategy is the right decision. Furthermore, there’s simply no point in having multiple indicators that show the same or similar information on the chart.
Here are some simple guidelines to follow to determine how many indicators a trader should use:
Are you a beginner, intermediate, or experienced trader?
Beginners might find indicators more useful as it helps to filter out signals. More experienced traders might find that they don’t require as many indicators, as they are intuitively skilled at reading price action and know which indicators are suitable for their strategy and which are not.
Are you a short-term or long-term trader?
If you’re a scalper and trading on the 5-minute chart, having many indicators on it would make things more difficult because of the frequency of the signals you receive. A trader utilising the daily chart has more time to think about the different signals and analyse the chart in detail.
What are your own preferences?
Think about what you feel most comfortable with a clean chart with only candlesticks, or perhaps 1-2 indicators on it, or a chart with a variety of indicators on it. If you feel overwhelmed by a large number of indicators, you might consider finding a strategy that centres around trading price action more suitable.
Regardless of how many indicators you wish to use – you should avoid having too many that essentially show the same, or very similar, information. As a general guide, try and stick to these four indicator groups:
- Trend indicators: Indicators that help you identify a trend, such as Moving Averages and Parabolic SAR.
- Momentum indicators: Oscillating indicators that help traders identify overbought and oversold conditions. Examples are RSI, Stochastics, and CCI.
- Volume indicators: Indicators that show the volume behind a particular price movement. For the FX spot, the data will not be as reliable as volume data (e.g. futures) because the FX market is decentralised. However, some traders will still find it useful to their own strategy.
- Volatility indicators: Indicators that assist traders in understanding the price range. Examples are Bollinger Bands and ATR.
Ready to trade your edge?
Join thousands of traders and trade CFDs on forex, shares, indices, commodities, and cryptocurrencies!
This information is not to be construed as a recommendation; or an offer to buy or sell; or the solicitation of an offer to buy or sell any security, financial product, or instrument; or to participate in any trading strategy. It has been prepared without taking your objectives, financial situation, or needs into account. Any references to past performance and forecasts are not reliable indicators of future results. Axi makes no representation and assumes no liability regarding the accuracy and completeness of the content in this publication. Readers should seek their own advice.
