Trading vs. Investing: What's the difference?
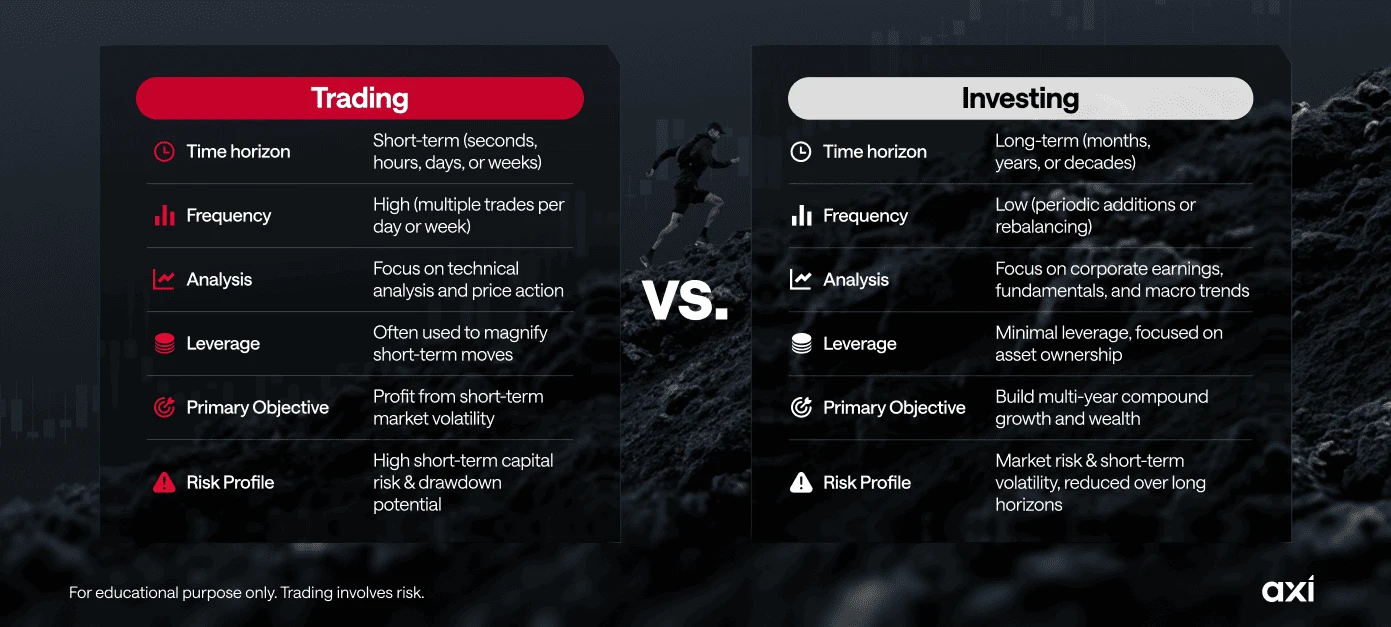
While both trading and investing aim to generate capital returns, they differ significantly in time horizon, execution frequency, and analytical approach:
| Feature | Trading | Investing |
|---|---|---|
| Time horizon | Short-term (seconds, hours, days, or weeks) | Long-term (months, years, or decades) |
| Frequency | High (multiple trades per day or week) | Low (periodic additions or rebalancing) |
| Analysis | Focus on technical analysis and price action | Focus on corporate earnings, fundamentals, and macro trends |
| Leverage | Often used to magnify short-term moves | Minimal leverage, focused on asset ownership |
| Primary objective | Profit from short-term market volatility | Build multi-year compound growth and wealth |
What can you trade? Markets, products and trading hours
Traders select financial markets based on liquidity, volatility profile, and operating hours:
Forex (currencies): The world's largest and most liquid financial market, operating 24/5. Participants trade major (e.g., EUR/USD), minor, and exotic currency pairs via spot pricing, FX CFDs, or institutional derivatives like options and swaps.
According to the BIS Triennial Central Bank Survey (2025), global OTC forex trading averaged $9.6 trillion per day in April 2025, up 28% from 2022. The US dollar was on one side of 89% of all FX trades, and FX swaps were the most traded instrument at around $4 trillion per day.
Stocks and indices: Trading stocks provides access to shares of publicly listed companies, while major indices track the broader performance of key global stock markets, such as the US30 (Dow Jones), GER40 (DAX), and JPN225 (Nikkei). Trading stock and index CFDs enables traders to speculate on both rising (long) and falling (short) prices, gaining exposure to price movements without owning the underlying asset.
Commodities: Includes physical raw materials such as energy (crude oil, natural gas), metals (gold, silver, copper), and agriculture (cocoa, coffee), traded OTC or through futures exchanges using commodity CFDs.
Cryptocurrencies: Digital asset markets operate continuously 24/7. Axi provides access to spot crypto, crypto CFDs, and crypto perpetual futures, allowing for both direct holding and directional hedging strategies.
Ways to trade: spot, CFDs and perpetual futures
You can often trade the same market using multiple products. Products differ in asset ownership, short-selling capabilities, and holding costs:
| Product | Own the underlying asset? | Go long and short? | Leverage | Expiry | Cost of holding a position |
|---|---|---|---|---|---|
| Spot (e.g., buying crypto outright) | Yes | Long only | No | None | None beyond the spread/fees paid to buy and sell |
| CFDs | No | Yes | Yes, using margin | None | Spreads, commissions and overnight financing charges. |
| Perpetual futures | No | Yes | Yes, using margin | None | Periodic funding payment; trading fees may also apply. |
| Dated futures | No (some settle physically) | Yes | Yes, using margin | Fixed date | Built into contract price; rolling to a new contract |
A CFD (contract for difference) is an agreement to exchange the difference in an asset's price between when a position is opened and when it is closed. You never own the asset, so a CFD position can be opened by selling (going short) as well as buying.
Related reading: CFD trading examples and the types of CFDs.
A perpetual future is a futures contract with no expiry date. To keep its price close to the underlying market, holders of long and short positions exchange funding payments at regular intervals. When the contract trades above the underlying price, longs usually pay shorts; when it trades below, shorts usually pay longs.
Related reading: What Are Perps? Perpetual Futures & Swaps Explained.
Dated futures carry an obligation to buy or sell at an agreed price on a set date. Options give the holder the right, but not the obligation, to buy or sell.
When are the markets open?
Forex trades around the clock from Sunday evening to Friday evening, passing through four main financial centres. Liquidity and volatility tend to rise when major trading sessions overlap.
| Session | Approximate hours (GMT) | What to expect |
|---|---|---|
| Sydney | 22:00–07:00 | Opens the trading week; AUD and NZD pairs are often more active |
| Tokyo | 00:00–09:00 | JPY pairs are often more active; overlaps with Sydney |
| London | 08:00–17:00 | Typically one of the busiest sessions, particularly for EUR and GBP pairs |
| New York | 13:00–22:00 | Overlaps with London from 13:00 to 17:00 GMT during standard time, creating high activity |
Session times can shift relative to GMT during daylight saving time transitions, while Tokyo does not observe daylight saving time. Share CFD trading hours generally follow their underlying exchange. Index CFD hours vary by instrument, and crypto markets operate 24/7.
Related reading: Forex market hours: What time does the forex market open?
Prices can gap when a market reopens after a weekend or public holiday, so a stop-loss may be filled at a worse price than specified. Check Axi's trading holidays calendar for schedule changes before holding positions through a holiday.
How does trading work?
The role of brokers, exchanges, and market makers
To place trades, you typically need an account with a broker. Brokers provide access to financial markets and platforms where you can analyse prices, submit orders, and manage positions.
Related reading: How to choose a forex broker.
Brokers may route orders to centralized exchanges (such as the NYSE or CME), arrange OTC execution, or act as principal (the counterparty to client trades, common in CFD trading).
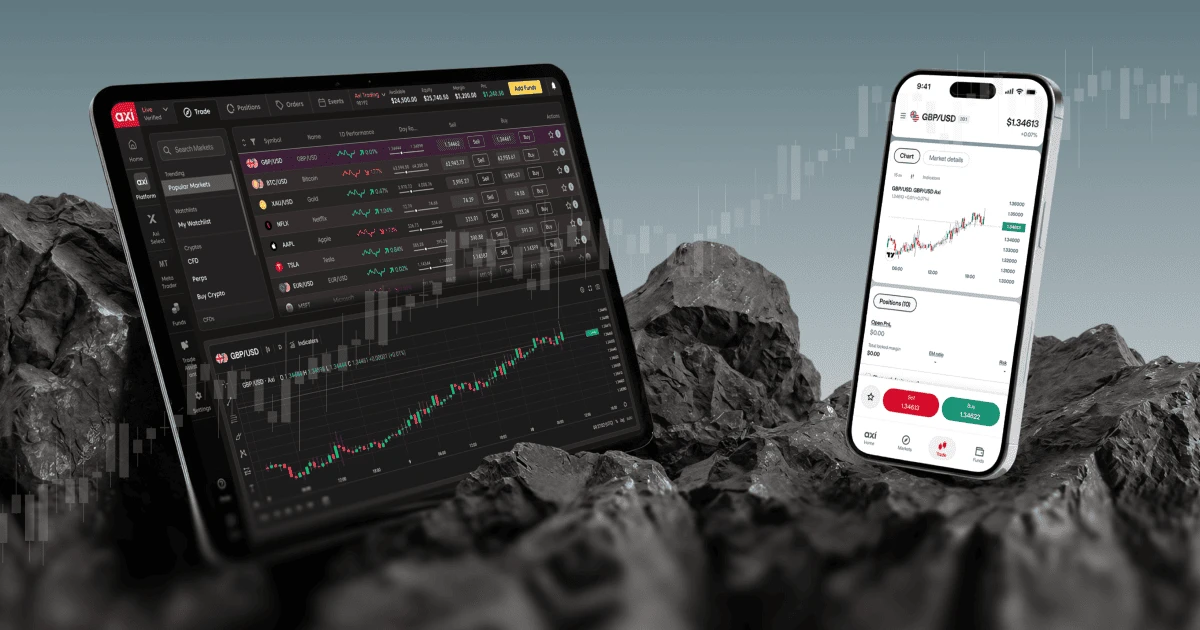
For example, Axi offers margin forex, CFDs, and perpetual futures and can act as principal to client trades. Its offering includes the Axi Trading Platform, market analysis tools such as Ask Axi, and educational resources. Axi also offers MT4 and MT5, with charting capabilities and support for tools such as Autochartist and Expert Advisors (EAs).
Bid-ask spreads and pricing
Financial assets display two prices:
- Bid price: The price at which the market or broker is willing to buy from you (exit price on long trades, entry price on short trades).
- Ask (offer) price: The price at which the market or broker is willing to sell to you (entry price on long trades, exit price on short trades).
The difference between these two quotes is the bid-ask spread, representing a primary cost when executing a trade.
See forex spreads in real-time.
Execution & order types
- Market orders: Instruct immediate execution at the best available current price.
- Limit orders: Pending orders to buy below current price or sell above it, executing only at specified levels.
- Stop orders: Triggered when price reaches a set threshold. Stop-loss orders automatically close a position to limit potential losses, while take-profit orders lock in gains once a target price is reached.
Pips, lots and contract size
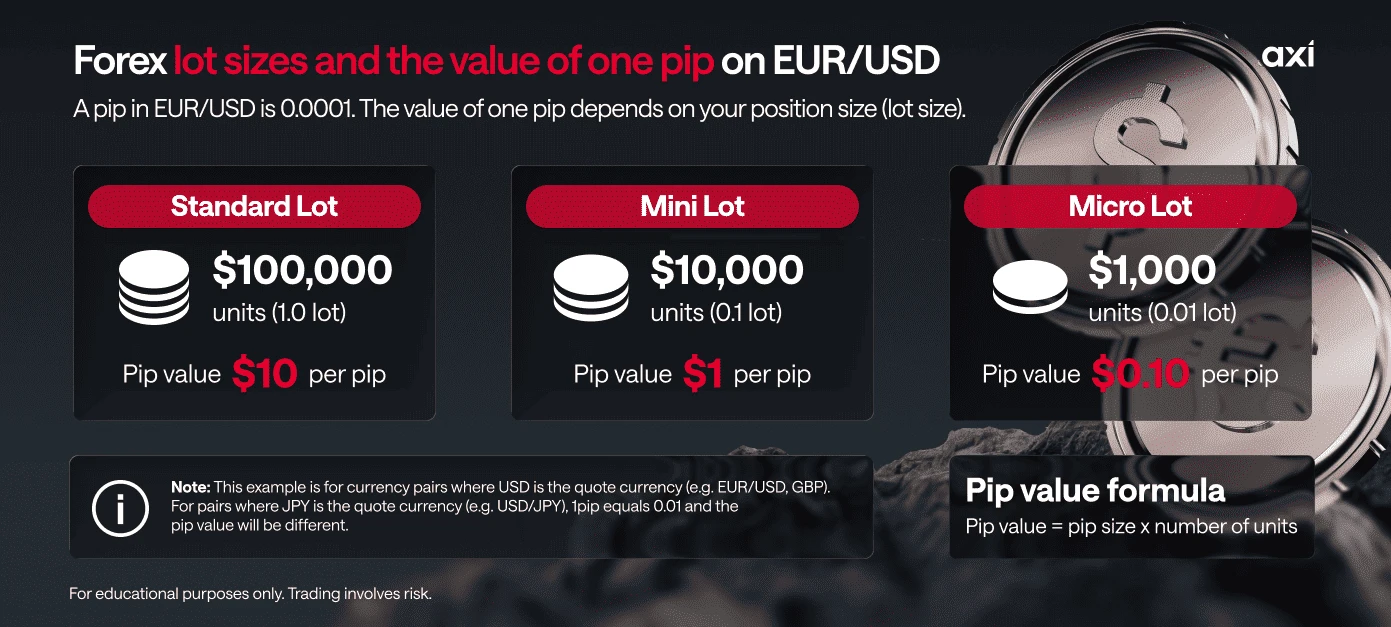
Forex price changes are measured in pips. For most currency pairs, a pip is the fourth decimal place (0.0001); for JPY pairs, it is the second decimal place (0.01). Platforms often quote an extra decimal (fractional pip or pipette), displaying EUR/USD as 1.10005.
Forex position size is set in lots:
| Lot size | Units of the base currency | Value of 1 pip on EUR/USD |
|---|---|---|
| Standard lot | 100,000 | $10.00 |
| Mini lot | 10,000 | $1.00 |
| Micro lot | 1,000 | $0.10 |
Pip value is calculated by multiplying the pip size by the number of units, with the result expressed in the quote currency.
For EUR/USD, the quote currency is the US dollar. A position of 100,000 units therefore has a pip value of 0.0001 × 100,000 = $10. If the pip value is not already in your account currency, it must be converted at the current exchange rate.
For CFDs on indices, commodities and shares, contract sizes vary by instrument.
Read also: What is a Pip in Forex Trading? Pips & Pipettes Explained
Leverage, initial margin, and margin calls
Margin trading allows traders to control positions larger than the amount of margin required to open them.
- Initial margin: The funds required to open a leveraged position. For example, a 1% margin requirement corresponds to 100:1 leverage.
- Leverage: Allows traders to control larger positions with less capital, amplifying potential gains and losses relative to the margin required.
Related reading: What Is Leverage in Trading? Forex & CFD Leverage Explained
- Margin call: A warning that your account has fallen below the broker's required margin level. If the margin level falls further, the broker may automatically close positions to limit additional losses.
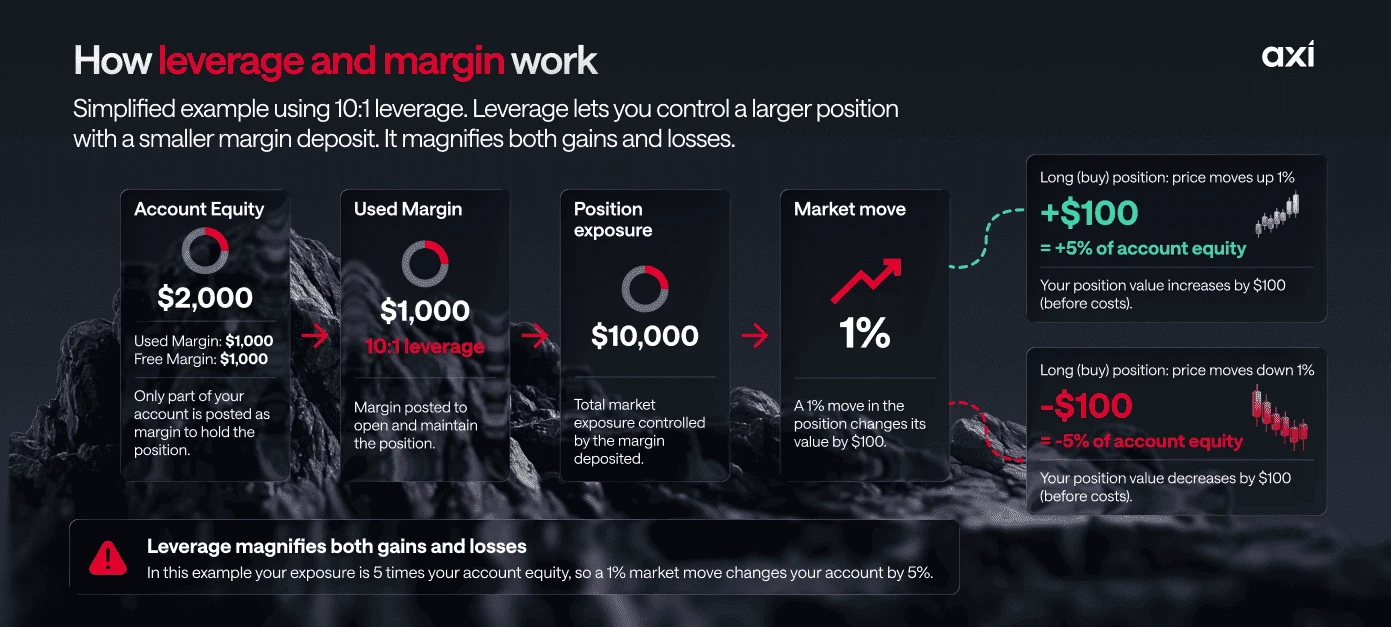 How leverage and margin work: Assume you have $2,000 in account equity and open a $10,000 position using 10:1 leverage, requiring $1,000 in margin. If the asset's price moves by 1%, your position gains or loses $100, equivalent to 5% of your initial account equity.
Example: how much margin does a trade need?
The margin required to open a position is calculated by dividing the position value by the leverage ratio.
Assume you open a EUR/USD position of 10,000 units at an exchange rate of 1.10005, giving it a value of $11,000.50. The margin requirements at different leverage levels would be:
| Leverage | Margin requirement | Margin needed |
|---|---|---|
| 30:1 | 3.33% | $366.68 |
| 100:1 | 1% | $110.01 |
Higher leverage allows you to control a larger position with the same amount of margin, or open the same position with less margin. In this example, the position size remains unchanged, so a 100-pip move against you results in a $100 loss at either leverage level.
Maximum leverage varies by instrument, regulatory entity and jurisdiction.
For illustration purposes only.
Regulatory safeguards and negative balance protection
Regulated brokers operate under the oversight of authorities such as the FCA, CySEC and ASIC. Depending on the jurisdiction and client classification, regulatory safeguards may include leverage limits and Negative Balance Protection, which helps prevent eligible retail clients from losing more than the funds in their protected trading accounts.
Trading costs: spreads, commissions, and overnight swaps
- Spreads: Built-in price markup between bid and ask quotes.
- Commissions: Flat transactional fees charged per lot, primarily on raw-spread execution accounts.
- Overnight swaps: Financing debit or credit applied when holding leveraged CFD position past the daily session close.
- Funding payments (perpetual futures): Periodic payments exchanged between long and short holders to maintain contract alignment with underlying spot prices.
How traders analyse the markets
Traders use technical and fundamental analysis to assess market conditions, identify opportunities and inform trading decisions.
Technical analysis
Technical analysis (TA) evaluates historical price action and volume patterns to identify recurring market setups:
- Price action and candlestick patterns: Assessing formations like double bottoms, head-and-shoulders, engulfing candles, and pin bars.
- Support and resistance levels: Identifying price floors and ceilings where supply or demand shifts.
- Technical indicators: Mathematical formulas applied to price and volume, such as Moving Averages (MA), the Relative Strength Index (RSI), and MACD.
Fundamental analysis
Fundamental analysis evaluates economic, financial, and geopolitical factors:
- Economic indicators: Central bank rate decisions, CPI inflation reports, Non-Farm Payrolls (NFP), and GDP growth.
- Corporate metrics: Earnings reports, EPS, revenue growth, and balance sheet health.
- Geopolitical developments: Supply chain shifts, trade policies, and global energy dynamics.
Main types of trading styles
Trading styles are defined by holding duration, time commitment, and analytical approach:
Position trading: Involves holding trades for periods ranging from several weeks to months to years to capture long-term macro trends driven primarily by fundamental analysis and economic cycles. Technical analysis is used secondarily to pinpoint entries, stop-loss placement, and take-profit targets.
Swing trading: Focuses on capturing short- to medium-term price momentum (swings) over days to weeks by buying at swing lows (support) and selling at swing highs (resistance). Technical analysis is the primary tool used to establish entry triggers, risk levels, and profit targets.
Day trading: Involves opening and closing all positions within a single trading day, ensuring no trades are held overnight to avoid overnight financing costs and gap risk. Requires active market monitoring around major economic news releases and session opens.
Scalping: An ultra-short-term trading style where positions are held for seconds or minutes to capture small price movements. Spreads, commissions, execution speed and slippage can have a significant effect on results. Traders may use short-timeframe charts and, where available, order-flow data.
Read also: Day Trading Strategies: 5 Intraday Techniques Explained
Step-by-step trade examples: how to trade different assets
Example 1: stock CFD trade (Microsoft)
Assume Microsoft (MSFT) is quoted with a bid-ask spread of $403.00 / $403.50, and you anticipate a positive earnings report.
- Trade setup: Open a long position of 10 share CFDs at the ask price of $403.50.
- Position value: 10 × $403.50 = $4,035.
Outcome A (market rises):
MSFT shares rally to $415.00 / $415.50. You close the position by selling at the bid price of $415.
Profit = ($415 - $403.50) x 10 = $115
Outcome B (market drops):
Earnings miss expectations and price falls to $395.00.
Loss = ($395 - $403.50) x 10 = -$85
Example 2: Forex CFD trade (EUR/USD)
Assume EUR/USD is quoted with a 1-pip bid-ask spread of 1.09995 / 1.10005. You anticipate the euro (EUR) will appreciate against the US dollar (USD).
- Trade setup: Open a long position of 10,000 units (0.10 standard lots, or 1 mini lot) at the ask price of 1.10005.
- Position value: 10,000 × $1.10005 = $11,000.50.
Outcome A (market rises):
The exchange rate moves to 1.12000 / 1.12010. You close the position at the bid price of 1.12000.
Profit = (1.12000 - 1.10005) x 10,000 = $199.50
Outcome B (market drops):
The rate falls to 1.09000 / 1.09010, triggering a stop loss at the bid price of 1.09000.
Loss = (1.09000 - 1.10005) x 10,000 = -$100.50
Example 3: commodity CFD trade (USOIL contract sizing)
Assume US Crude Oil (USOIL) is quoted with a 3-cent bid-ask spread at 78.50 / 78.53, where 1 standard lot represents 1,000 barrels ($0.01 price move = $10.00).
- Trade setup: Open a long position of 1 standard lot (1,000 barrels) at the ask price of 78.53.
- Position value: 1,000 × $78.53 = $78,530.
Outcome A (market rises):
USOIL rallies to 78.90 / 78.93. You close the position by selling at the bid price of 78.90.
Profit = ($78.90 - $78.53) x 1,000 barrels = $370
Outcome B (market drops):
Price declines to 78.20, triggering your stop loss at the bid price of 78.20.
Loss = ($78.20 - $78.53) x 1,000 barrels = -$330.00
Risk management essentials
Managing risk is the single most critical factor determining long-term trading survival.
The 1% per-trade risk rule
Limiting planned losses on individual trades to 1% of account equity can help preserve capital and manage drawdowns. On a $10,000 account, a 1% risk limit means risking no more than $100 on a single trade, under normal execution conditions. Actual losses may be higher due to market gaps or slippage
Setting effective stop-loss and take-profit orders
Stop-loss and take-profit orders help traders manage risk and reduce emotional decision-making by automatically closing positions when predefined price levels are reached.
- Stop-loss orders: Close a position when the market reaches a specified level to help limit potential losses. Traders often place them beyond recent price highs or lows, based on their trading strategy.
- Take-profit orders: Close a position when a predetermined profit target is reached. These targets may be based on key support and resistance levels or other technical indicators.
Stop-loss orders do not guarantee execution at the specified price, particularly during periods of high market volatility.
Risk-to-reward ratios
The risk-to-reward ratio compares the potential loss on a trade with its potential profit:
- 1:2 ratio: Risking $100 to potentially make $200.
- 1:3 ratio: Risking $100 to potentially make $300.
A favourable risk-to-reward ratio can help a trading strategy remain profitable even when fewer than half of its trades are successful, provided gains outweigh losses and trading costs.
Axi Market Analyst Milan Cutkovic highlights a common mistake: "The mistake I see most often is moving a stop-loss further away once a trade goes against you. It usually starts with the hope that price will turn around, but it turns a small, planned loss into a much larger one. A few of those can undo weeks of disciplined trading. Define your risk before you enter the trade, and stick to it."
Managing drawdown and avoiding overtrading
Drawdown measures the decline in trading account equity from a previous peak to a subsequent low.
- Daily loss limits: Setting a maximum daily loss cap (e.g., 3% of account equity) can help control risk. Once this limit is reached, trading is paused for the remainder of the day to avoid further losses driven by emotional decisions.
- Avoiding overtrading: Overtrading occurs when a trader places unnecessary trades out of boredom, impatience, or an attempt to recover losses. Following a predefined trading plan can help maintain discipline and reduce impulsive decisions.
Expectancy and the break-even win rate
A risk-to-reward ratio only provides a complete picture when evaluated alongside a strategy's win rate. Expectancy combines these metrics to calculate the average expected result per trade:
The minimum win rate needed to break even, before transactions costs, is calculated as 1 ÷ (1 + reward-to-risk):
| Risk-to-reward | Break-even win rate (before costs) |
|---|---|
| 1:1 | 50% |
| 1:2 | 33.3% |
| 1:3 | 25% |
For example, risking $100 to make $200 with a 40% win rate yields (0.40 × $200) - (0.60 × $100) = $20 per trade before costs. At a 30% win rate, the same ratio yields (0.30 × $200) - (0.70 x $100)= -$10 per trade.
Transactions costs push the actual break-even win rate higher, and a win rate measured over small sample sizes may not hold across changing market regimes.
For illustration purposes only. Past performance is not indicative of future results.
How to trade for a living: transitioning from practice to real capital
Before moving from demo to live trading, consider the following:
Consistent execution:
Follow a documented trading plan and risk management rules, recording trades and reviewing any deviations.
Performance evaluation:
Assess whether a strategy produces positive results after trading costs across a meaningful sample of trades and varied market conditions.
Risk control:
Apply clear limits on position size and overall exposure, with a plan for managing volatility and responding to drawdowns.
Meeting these checkpoints does not mean you are ready to rely on trading for income. Start gradually and keep money needed for living expenses separate.
Practising on a demo account
A demo account allows traders to simulate order placement, test technical strategies, and familiarise themselves with trading software without risking capital.
While demo trading cannot fully replicate the psychological pressures of live market execution, it serves as a sandbox for practising strategy and getting accustomed to the mechanics of the platform
Capital allocation and prop trading programs
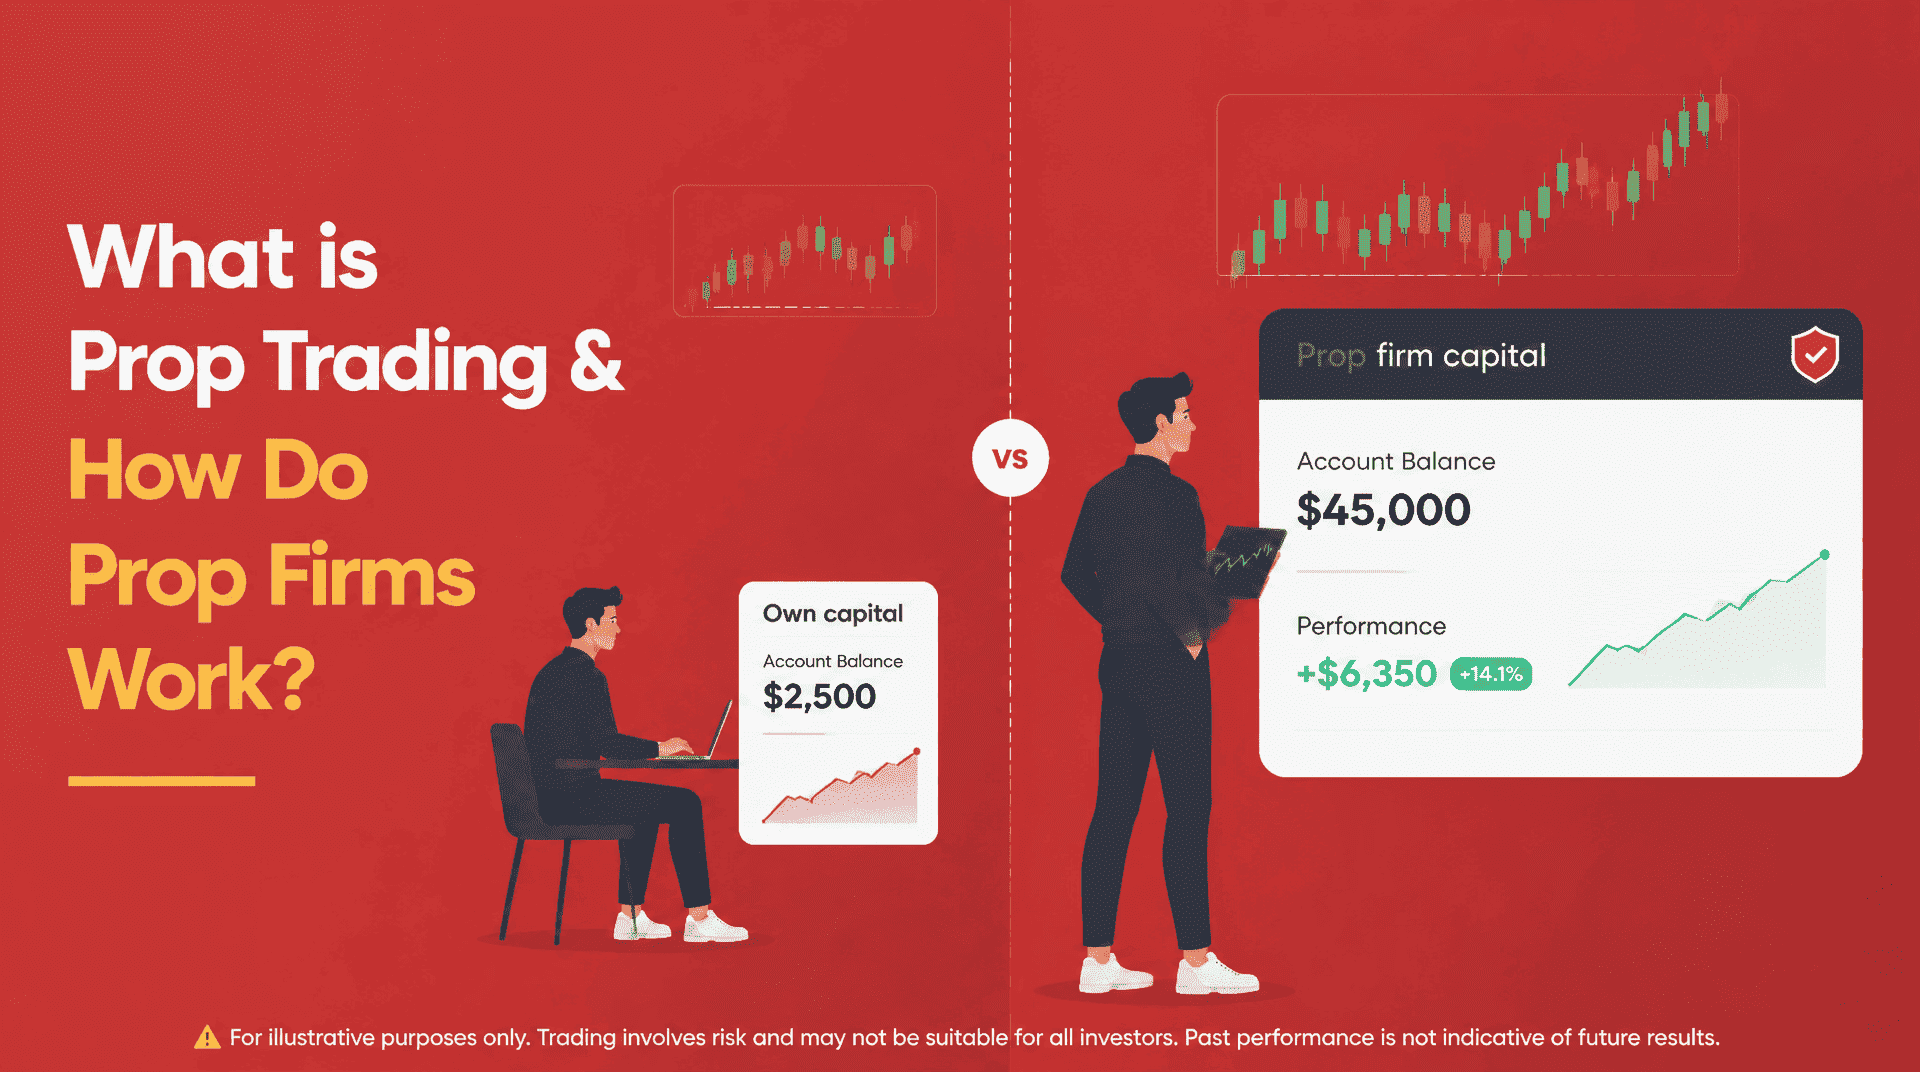
Prop trading and capital allocation programs, such as Axi Select, offer eligible traders opportunities to access funded trading capital through performance-based progression.
- Performance requirements: Traders must meet defined performance criteria and follow risk management rules, including drawdown limits.
- Scaling opportunities: Consistent performance and disciplined risk management can allow traders to progress to higher funding levels and earn a share of eligible trading profits.
- Professional discipline: Following programme rules encourages structured trading, consistent execution and responsible risk management.
Advantages and disadvantages of trading
Key benefits
- Easy access: Online platforms let you trade a range of global markets from your computer or mobile device.
- Two-way positioning: Derivatives like CFDs and perpetual futures permit long and short exposure.
- Access to leverage: Margin trading lets you open a larger position with a smaller initial deposit, increasing potential profits and losses.
- Flexible trading hours: Forex markets generally operate 24 hours a day, five days a week, while perpetual futures offer trading seven days a week, subject to product schedules and maintenance breaks.
Risks and challenges
- Market volatility: Rapid price shifts caused by macroeconomic announcements or geopolitical news can trigger sudden market slippage and unexpected losses.
Read also: What is Volatility in trading? Forex Volatility Explained
- Amplified leverage risk: While leverage increases profit potential, it equally magnifies losses relative to your initial account balance.
- Psychological pressure: Managing open exposure demands discipline. Fear, greed, and anxiety can lead to hasty exits, moving stop losses, or over-leveraging.
- Adapting to change: A strategy that works when prices move steadily up or down may struggle when they stay within a narrow range. Traders need to review their approach as market conditions change.
Common trading mistakes to avoid
Trading without a clear plan or reacting emotionally to short-term market movements can lead to unnecessary risk. Common mistakes include:
- Using excessive leverage or opening positions that are too large relative to account equity.
- Entering trades without defining an exit strategy or the conditions that would invalidate the trade.
- Overlooking spreads, commissions and financing costs when assessing potential returns.
- Increasing position sizes in order to recover losses quickly.
- Assuming that a short series of profitable trades demonstrates a strategy's long-term effectiveness.
- Abandoning a trading plan after a single loss or a short sequence of losing trades.
Conclusion and getting started
Trading allows you to speculate on price movements across forex, stocks, commodities, indices, and cryptocurrencies. Success requires understanding how trades work, developing a clear trading plan, and setting limits on how much you are prepared to risk.
To begin:
- Register a trading account: Open an account with a regulated broker offering tier-1 safety standards and execution tools.
- Develop a clear trading plan: Define target asset classes, entry criteria, leverage parameters, and risk limits.
- Start with a demo account: Test your trading strategies and platform tools risk-free before transitioning to live capital.
Frequently asked questions (FAQs)
What is Negative Balance Protection?
Negative Balance Protection (NBP) helps prevent traders from losing more than the funds in their trading account. It is a regulatory requirement for retail CFD accounts in certain jurisdictions, including the UK and Australia. Availability depends on the broker, product, jurisdiction and client classification. Please note that NBP does not apply to clients registered with SVG.
What is the difference between a market order and a limit order?
A market order instructs the broker to execute a trade at the best available price, prioritising execution over price certainty. A limit order specifies the price at which you want to buy or sell, or a better price. Unlike market orders, limit orders may not be executed.
How much money do I need to start trading?
The amount needed depends on the instrument, broker's minimum deposit requirements, position size and leverage. Traders should also consider their risk tolerance and available capital, using only funds they can afford to lose.
Can trading become a source of income?
Trading can generate income, but profits are neither guaranteed nor predictable. Results depend on market conditions, trading strategies and risk management. Anyone considering trading as a source of income should keep essential living expenses separate from trading capital and account for potential losses.
Can I lose more money than I deposit?
Where Negative Balance Protection applies, eligible retail clients are protected from losing more than the funds covered by that protection, even during extreme market movements.
What is the difference between trading and forex trading?
Trading covers a wide range of financial markets, including forex, stocks, indices, commodities and cryptocurrencies. Forex trading focuses specifically on buying and selling currencies, typically in pairs such as EUR/USD or GBP/USD.
What is the spread in trading?
The spread is the difference between the bid (sell) and ask (buy) prices of a financial instrument. It represents a trading cost and can vary depending on market conditions, liquidity and the instrument being traded.
What is leverage in trading?
Leverage allows traders to control a larger position with a smaller amount of margin. For example, at 30:1 leverage, a $10,000 position requires approximately $333.33 in margin. Because profits and losses are calculated on the full position value, leverage can amplify both gains and losses.
What is a pip?
A pip is a standard unit used to measure price movements in forex. For most currency pairs, one pip equals 0.0001, while for most Japanese yen pairs, it equals 0.01. For a standard lot of EUR/USD (100,000 units), one pip is worth $10.
How do Axi's CFDs and perpetual futures fit into a trading strategy?
Axi's CFDs and perpetual futures allow traders to take long or short positions across global markets without owning the underlying assets. These instruments can be used to hedge existing exposure or speculate on short-term price movements. CFDs typically follow underlying market trading hours, while eligible perpetual futures can be traded 24/7, with no fixed expiry date.
This information is not to be construed as a recommendation; or an offer to buy or sell; or the solicitation of an offer to buy or sell any security, financial product, or instrument; or to participate in any trading strategy. It has been prepared without taking your objectives, financial situation and needs into account. Any references to past performance and forecasts are not reliable indicators of future results. Axi makes no representation and assumes no liability with regard to the accuracy and completeness of the content in this publication. Readers should seek their own advice.

Axi Team
The Axi team brings together specialists with decades of experience across every major financial sector. As authors of our expert articles and trading guides, we share insight into forex education, the stock market, and commodities. We use this collective knowledge to provide the practical perspective needed to navigate the markets effectively.