

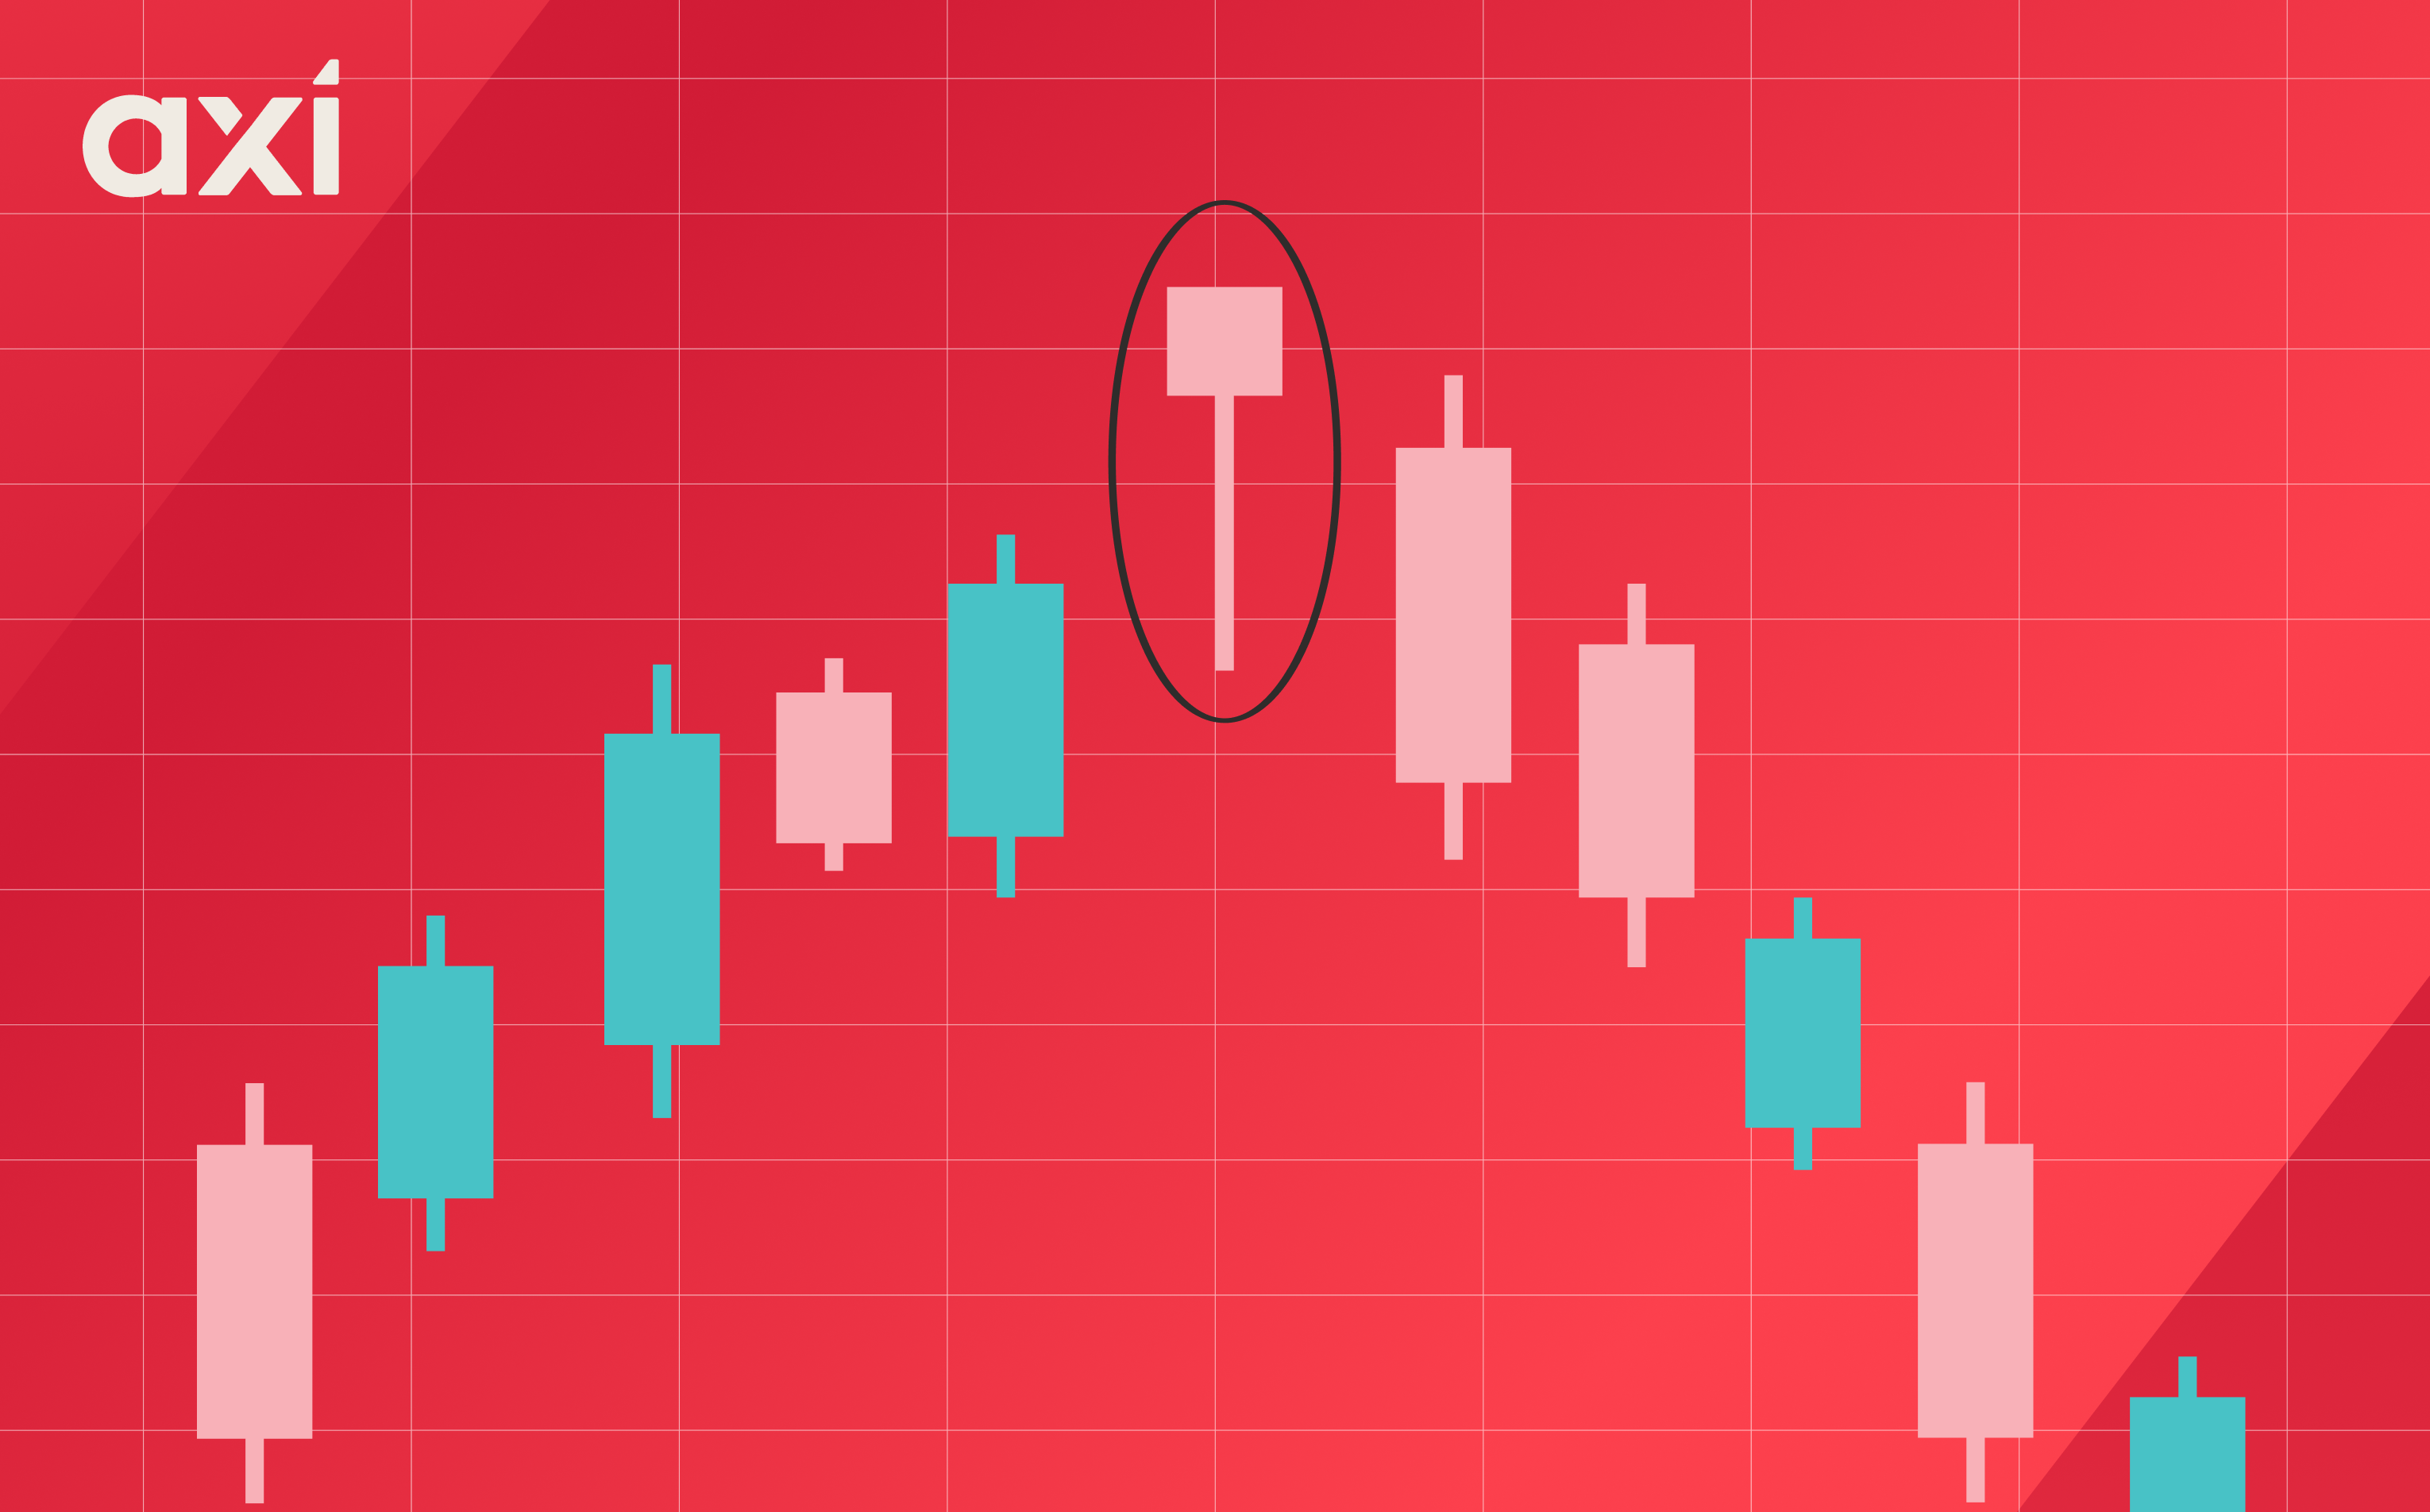
The hanging man is a candlestick pattern that signals a bearish trend reversal. The pattern is easy to spot and appears frequently. The hanging man consists of a single candlestick that has a small body, a long lower shadow and little or no upper shadow. It can appear on all chart timeframes of all asset classes.
The hanging man pattern appears during an uptrend and signals that the trend might have reached its end and that a bearish reversal is about to follow.
As with every candlestick, the hanging man tells us a story about the price action. The long lower shadow indicates that sellers have been able to push prices down significantly during the candlestick session. Even though buyers eventually managed to regain control, which enabled the candle to close near the session high, the sell-off shows that the bullish momentum has weakened.
The hanging man consists of a single candlestick that has a small body, which can be either green or red. It has a long lower shadow, which usually is at least twice the size of the body, and it has a small or no upper shadow.
The hanging man pattern looks like the hammer pattern; however, the key difference is that the hanging man occurs during an uptrend and indicates a bearish reversal.
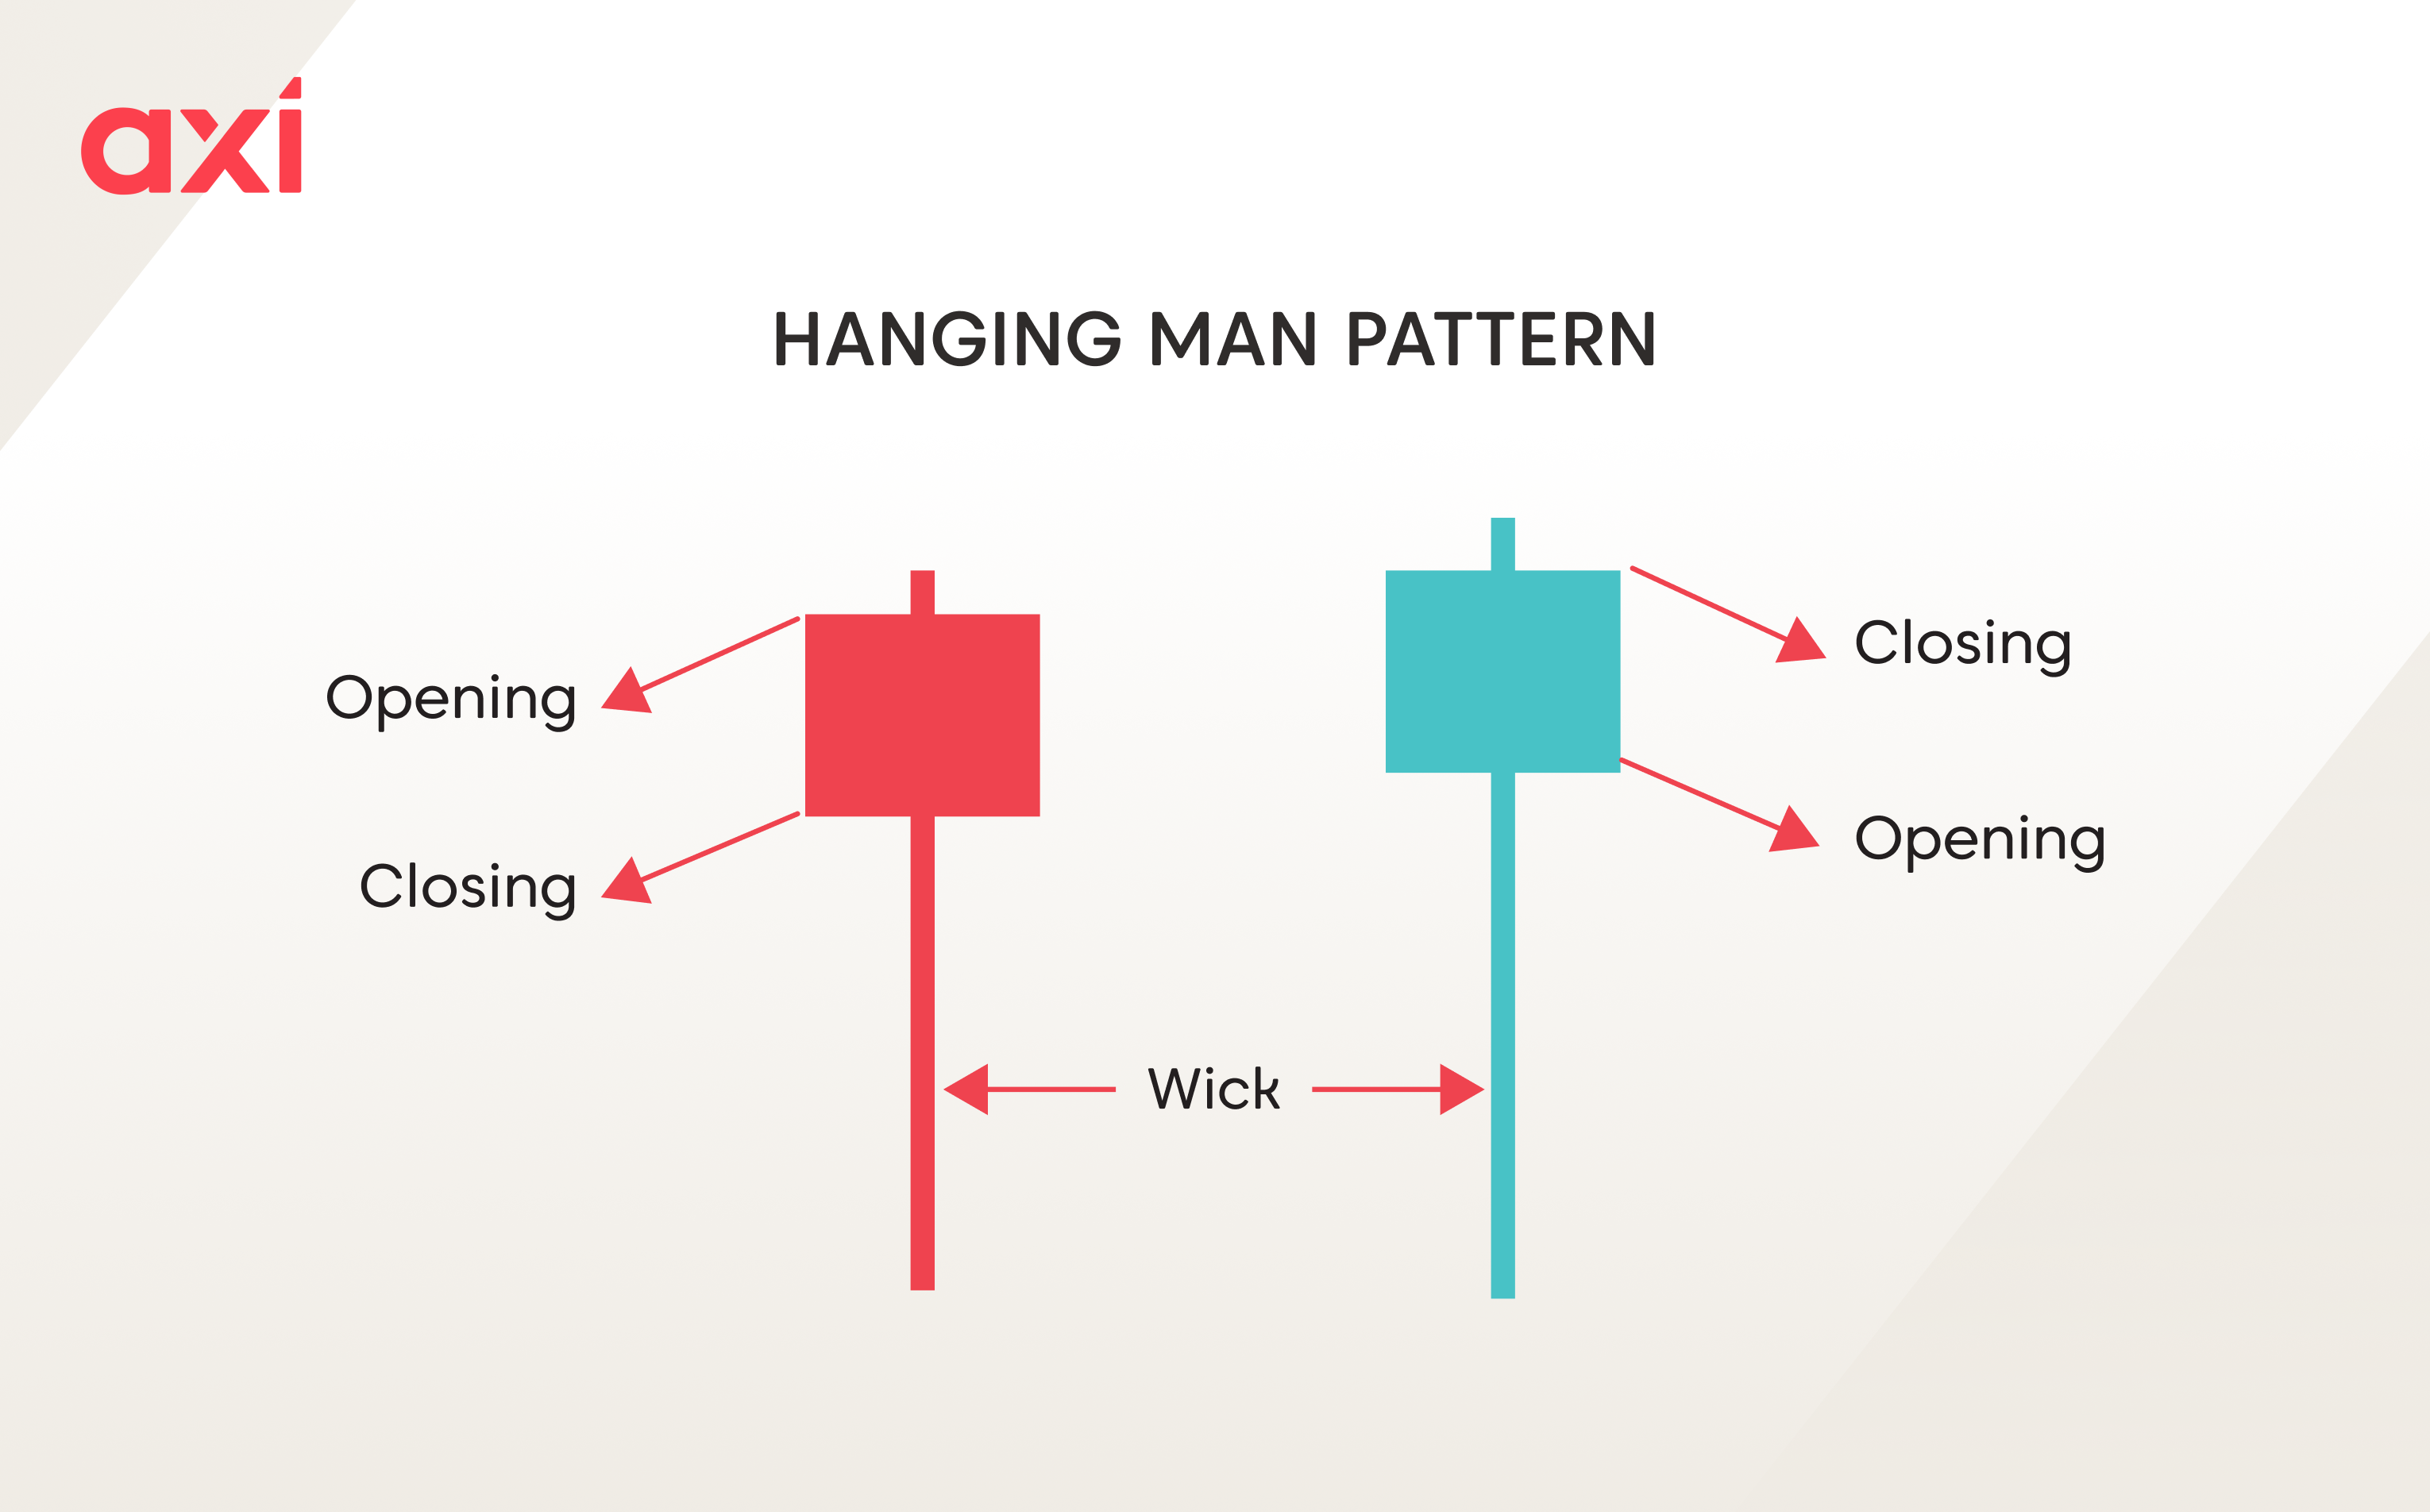
A hanging man can appear as either a green or red candlestick.
If the body is green, it shows that the price recovered more significantly, enabling bulls to push it above the open price of the session.
On the other hand, a red candle indicates that although bulls managed to push the price higher, sellers gained control towards the end of the session, causing the price to close below the opening price.
While both are valid patterns, a red hanging man is preferred and regarded as a stronger signal, as it suggests an anticipated bearish trend reversal.
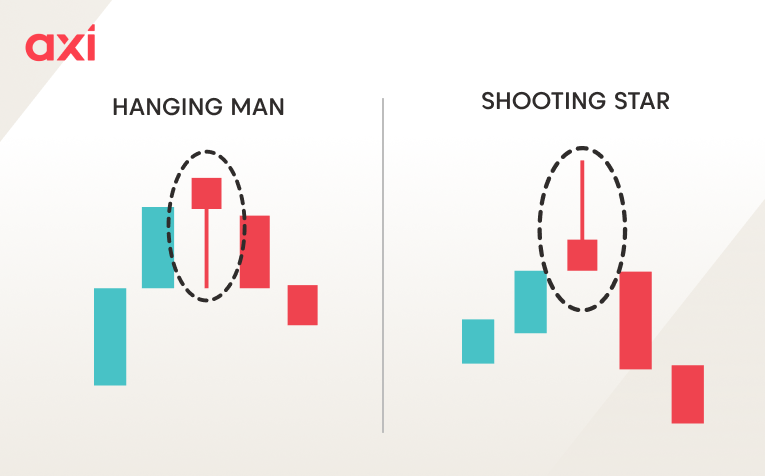
The shooting star looks like an inverted version of the hanging man.
They both appear during an uptrend and signal a bearish reversal. However, the shooting star has a long upper shadow and a small body at the bottom, with a small or no lower shadow at all.
The shooting star indicates stronger bearish price action, as buyers tried to push the price higher but failed, and a strong sell-off occurred.
The hanging man is a pattern that is easy to spot. It can appear on all timeframes and on charts of all instruments.
It is important to note that we are seeking a hanging man pattern to emerge during an uptrend, as it signifies a bearish reversal pattern.
The hanging man is a candlestick pattern characterised by several key features:
As with any candlestick pattern, it is essential to wait for the subsequent candlestick to confirm it. Since the hanging man is recognised as a bearish reversal pattern, we would anticipate a bearish (red) candle to follow. An ideal scenario would involve a large red candle that completely engulfs the body of the hanging man.
To begin trading a hanging man pattern, the first step is to confirm that the instrument is currently in an established uptrend.
Once you identify a hanging man candlestick, wait for a confirmation of the potential bearish reversal. This confirmation typically arrives with the subsequent candlestick, which should be a bearish candle closing below the body or the lower part of the hanging man.
Upon receiving the confirmation, consider entering a short position, placing a stop-loss order just above the high of the hanging man to manage risk.
The candlestick pattern itself does not provide a specific take-profit target. Therefore, most traders will determine their exit points by observing the next significant support level or by applying a predetermined risk-to-reward ratio that aligns with their trading strategy.
A hanging man candlestick that appears close to a major resistance level can significantly strengthen the bearish signal. This is because the resistance level already suggests potential selling pressure, and the hanging man formation can act as a trigger, increasing the likelihood of a downward move and potentially offering higher probability trading opportunities.
Furthermore, incorporating supporting technical indicators can provide additional confidence in the signal. For example, if a hanging man forms while an indicator like the Relative Strength Index (RSI) is indicating overbought conditions, it can add confluence to the bearish outlook and potentially lead to more informed trading decisions.
The hanging man is a popular candlestick pattern that signals a bearish reversal. It appears during an uptrend and is easy to identify due to its simple structure, which consists of a candlestick with a small body located towards the top of the candle, a long lower shadow and no or a small upper shadow.
It is crucial to wait for a confirmation prior to trading the hanging man pattern, which comes in the form of a bearish candle appearing after the hanging man. If the hanging man appears near a key resistance level, the signal becomes even stronger.
Ready to trade your edge?
Join thousands of traders and trade CFDs on forex, shares, indices, commodities, and cryptocurrencies!
This information is not to be construed as a recommendation; or an offer to buy or sell; or the solicitation of an offer to buy or sell any security, financial product, or instrument; or to participate in any trading strategy. It has been prepared without taking your objectives, financial situation and needs into account. Any references to past performance and forecasts are not reliable indicators of future results. Axi makes no representation and assumes no liability with regard to the accuracy and completeness of the content in this publication. Readers should seek their own advice.
FAQ
A candlestick pattern that appears during an uptrend and signals a bearish trend reversal.
It indicates that the bullish momentum has been lost. Although buyers managed to push the price higher again towards the end of the session, the sharp selloff can serve as a warning sign.
A hanging man can be either green or red; both are recognised as valid patterns. However, a red hanging man is preferred, as it serves as a stronger signal.
Yes, the hanging man appears on all timeframes.
Once a hanging man appears, and you have confirmed the instrument is in an uptrend, wait for the next candle to be a bearish one, which would confirm the pattern. You could then enter a short position.
It is typically positioned just above the highest point of the hanging man.
Traders usually use the next significant support level to identify an appropriate exit level.
