
Login with email
Fibonacci is a series of numbers where each number in the sequence is the sum of the previous two. They are used in technical analysis to predict future movements by identifying areas that will bring balance to an asset's price.
When applied to trading charts, Fibonacci levels indicate how much of an asset's value has been traded during a specific timeframe and can be used as major turning points in trend direction. The timeframes range from minutes, hours, days, and weeks with traders using different combinations for various purposes such as catching trends or finding support and resistance levels.
You will notice that when you plot Fibonacci retracement levels on your charts they align beautifully with significant highs and lows. These high-probability areas act as perfect entry or exit points for trades because they have proven over time to show where price has reversed from a new trend.
Understanding Fibonacci can help beginner traders better understand market sentiment and improve their knowledge of important aspects like volatility and trendlines. Let's dive further into exactly what are Fibonacci retracement levels and how to use one of the best technical indicators in your trading.
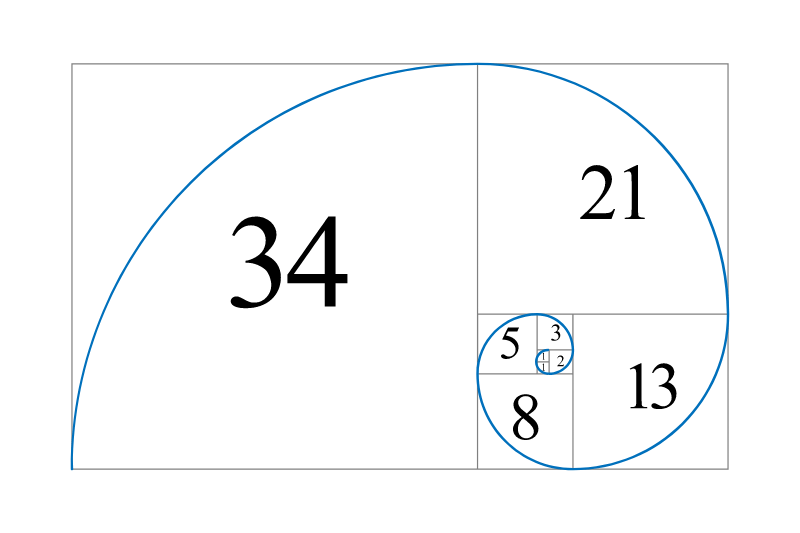
The Fibonacci sequence is a series of numbers that forms a mathematical pattern. The sequence starts with zero and one and continues by adding the previous two numbers.
Hence the sequence is 0,1,1,2,3,5,8,13,21,34,55,89,144 and so on...
When we talk about the Fibonacci sequence, we often mention the "Golden Ratio", which is roughly 1.618. The ratios of sequential Fibonacci numbers are often close to the Golden Ratio.
For example, 5/3 = 1.67, 8/5 = 1.6 ...144 / 89 =1.6179 and so on. The higher the numbers, the closer they get to the Golden Ratio.
Fibonacci retracement levels are support and resistance levels that are based on the Fibonacci numbers. Those are 23.6%, 38.2%, 61.8%, and 78.6%. When drawing Fibonacci levels, your trading software is likely to include the 50% level, even though it is not officially a Fibonacci retracement level.
You are probably thinking to yourself who is this Fibonacci?
Fibonacci - also known as Leonardo of Pisa - was an Italian mathematician and is considered to be one of the most skilled mathematicians of his time. He was born in 1170, and aside from the Fibonacci sequence, he became famous for his manuscript on arithmetic called "Liber Abaci". A statue of Fibonacci was built in Pisa in the 19th Century, and it still exists today.
The Fibonacci levels (or "Fibo levels") are considered a self-fulfilling prophecy. If enough traders keep an eye on those levels and use them actively in their trading, they will become levels of support and resistance.
The idea behind it is that prices never move in a straight line. After a large price movement, a retracement may follow before the prevailing trend continues. Fibonacci retracement levels help traders identify where those levels of support and resistance are. Fibonacci is one of the most common and well-known technical indicators used by traders when performing technical analysis.
When you draw a Fibonacci retracement on your chart, you will notice that we do not actually use the numbers in the sequence. Instead, the ratios or differences between the numbers in the sequence are utilised.
Let's have a look at the most popular one - 61.8 % - as an example. We get this number by dividing a number in the Fibo sequence by a certain number that succeeds it.
The major Fibonacci retracement levels are:
Minor levels:
Some traders prefer to focus just on the major levels, while others like to include all of them.
There are some basic rules that need to be followed when drawing Fibonacci retracements, but there is also a certain degree of discretion present. It already starts with the point where you choose to measure the Fibo retracement. Two traders might get different results, based on what they identified as major low/high. Generally, it is easier to practice on the higher timeframe charts, before moving down to the hourly or minutes charts.
Identify the major high/low. Looking at the GBP/USD Daily chart below, it is obvious which two points we should connect.
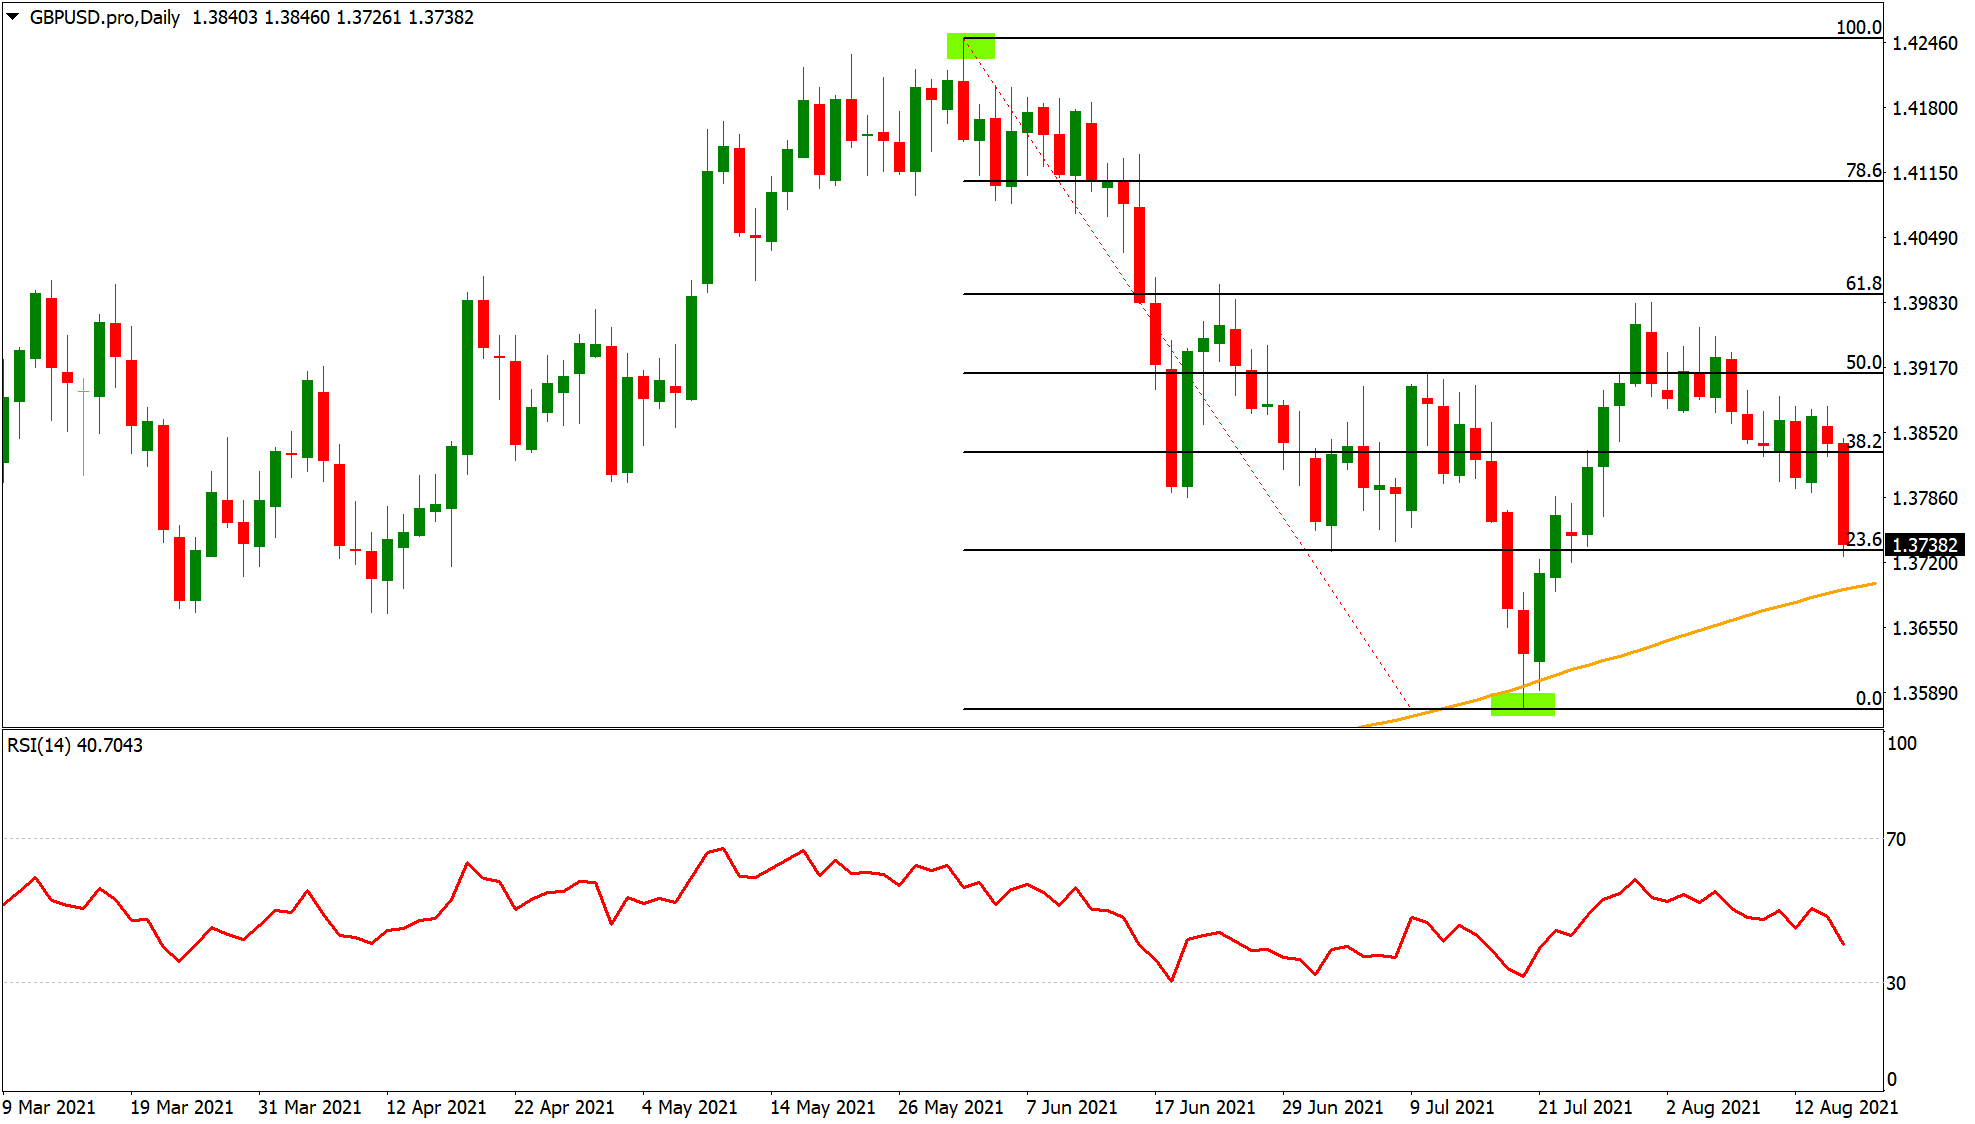
Connect the two points (major high/low). In MT4, a trendline and the required Fibonacci levels will automatically appear.
Utilise the Fibonacci levels as support/resistance. A good example is the 61.8% retracement level which acted as a major level of resistance on three occasions, and which the currency pair was unable to breach.
Most traders use the Fibo levels as classic support and resistance levels.
This means they can be used as entry-level or help traders determine their stop/take profit targets.
Here are some examples of traders utilising the Fibonacci technical indicator in their trading:
Example 1: A trader uses multiple technical analysis tools, and they all indicate that the USD/CAD uptrend will continue. However, the trader feels that in the short term, the currency pair is oversold and that there will be another retracement before the trend resumes. As a fan of Fibonacci levels, he is looking at the area around the 38.2% Fibo as a potential entry point.
Example 2: A trader who is currently long USD/CAD is trying to determine where he should place his stop-loss order. As a user of Fibonacci, he sees that the 38.2% level has acted as a key level of support before, and he decides to place his stop 50 pips below it.
Drawing the Fibonacci retracement on a chart in your MT4 platform could not be easier. You will find the "F" symbol in the menu at the top. Clicking on it will enable you to go back to the chart to draw the Fibo levels. Simply click on the high/low and connect it with the other point. The levels and trendline will automatically appear.
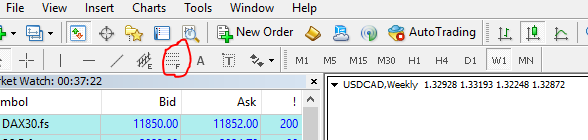
To adjust the Fibo tool (levels/colours) simply right-click anywhere in the chart and select "Objects List". The Fibonacci retracement should appear there, and you can then select "Edit" in the menu on the right side.

As Fibonacci levels are essentially classic support/resistance levels, it is not difficult to combine them with other technical analysis tools. While some traders may choose to build a whole strategy around the Fibo numbers, many of them use it as a supporting tool.
Fibonacci retracement levels can be used in addition to moving averages, which give an indication of the overall trend, as well as oscillators - such as the RSI - which can hint at overbought or oversold market conditions.
Fibonacci extensions show traders how far the next price move could go following a retracement. It is mostly used to determine take profit levels and popular extension levels are: 100%, 161.8%, 200%, and 261.8%.
You can draw them with the same tool as you would to find the retracement level, and just need to look beyond the 100% level. The main difference between the Fibonacci retracements and extensions is that the retracements try to show how deep a retracement within a trend could go, while the extensions measure how far an extension of the existing trend could go.
There is no straight answer to this, but the fact is that the 38.2% and 61.8% retracement levels are commonly watched by traders, and since Fibonacci levels are essentially a self-fulfilling prophecy, you may notice that the price tends to have a more significant reaction at those two particular levels.
Ready to trade your edge?
Join thousands of traders and trade CFDs on forex, shares, indices, and commodities!
This information is not to be construed as a recommendation; or an offer to buy or sell; or the solicitation of an offer to buy or sell any security, financial product, or instrument; or to participate in any trading strategy. It has been prepared without taking your objectives, financial situation, or needs into account. Any references to past performance and forecasts are not reliable indicators of future results. Axi makes no representation and assumes no liability regarding the accuracy and completeness of the content in this publication. Readers should seek their own advice.

