What is a doji candlestick pattern and how to trade it?

What is a Doji candle?
A Doji is a candlestick pattern that indicates market indecision. There are several types of Doji candles, but all of them share some characteristics, which are:
- The open and close price of the candle are the same or almost the same.
- The candle does not have a body at all or barely a body.
- The wicks of the Doji can vary in length.
The Doji is a common candlestick pattern that can be found across all timeframes and asset classes. While it's straightforward to spot, its frequent occurrence means it carries more weight when located near important support or resistance levels.
What does Doji mean?
The word "Doji" is Japanese and roughly translates to "simultaneous". The reason for that is that the candlestick has an opening and closing price that is the same or nearly the same.
What does a Doji candle indicate?
The Doji itself signals that neither buyers nor sellers are in control, which is why the opening and closing price almost match.
However, the broader context is very important, as a Doji candle on its own offers limited insight.
Take an example where an instrument is trading sideways in a narrow range, and a Doji forms at the center. This adds little insight, as the chart already reflects indecision and the absence of a prevailing trend, as neither bulls nor bears are in control.
If the instrument, however, is in a strong uptrend or downtrend, the Doji can prove far more valuable. Particularly if it appears at a key support or resistance level, which could indicate a potential trend reversal.
That said, a Doji doesn't necessarily indicate a trend reversal. In the context of a strong uptrend, if a Doji is followed by a solid bullish candle, it typically suggests a brief pause in momentum rather than a reversal.
Types of Doji candles
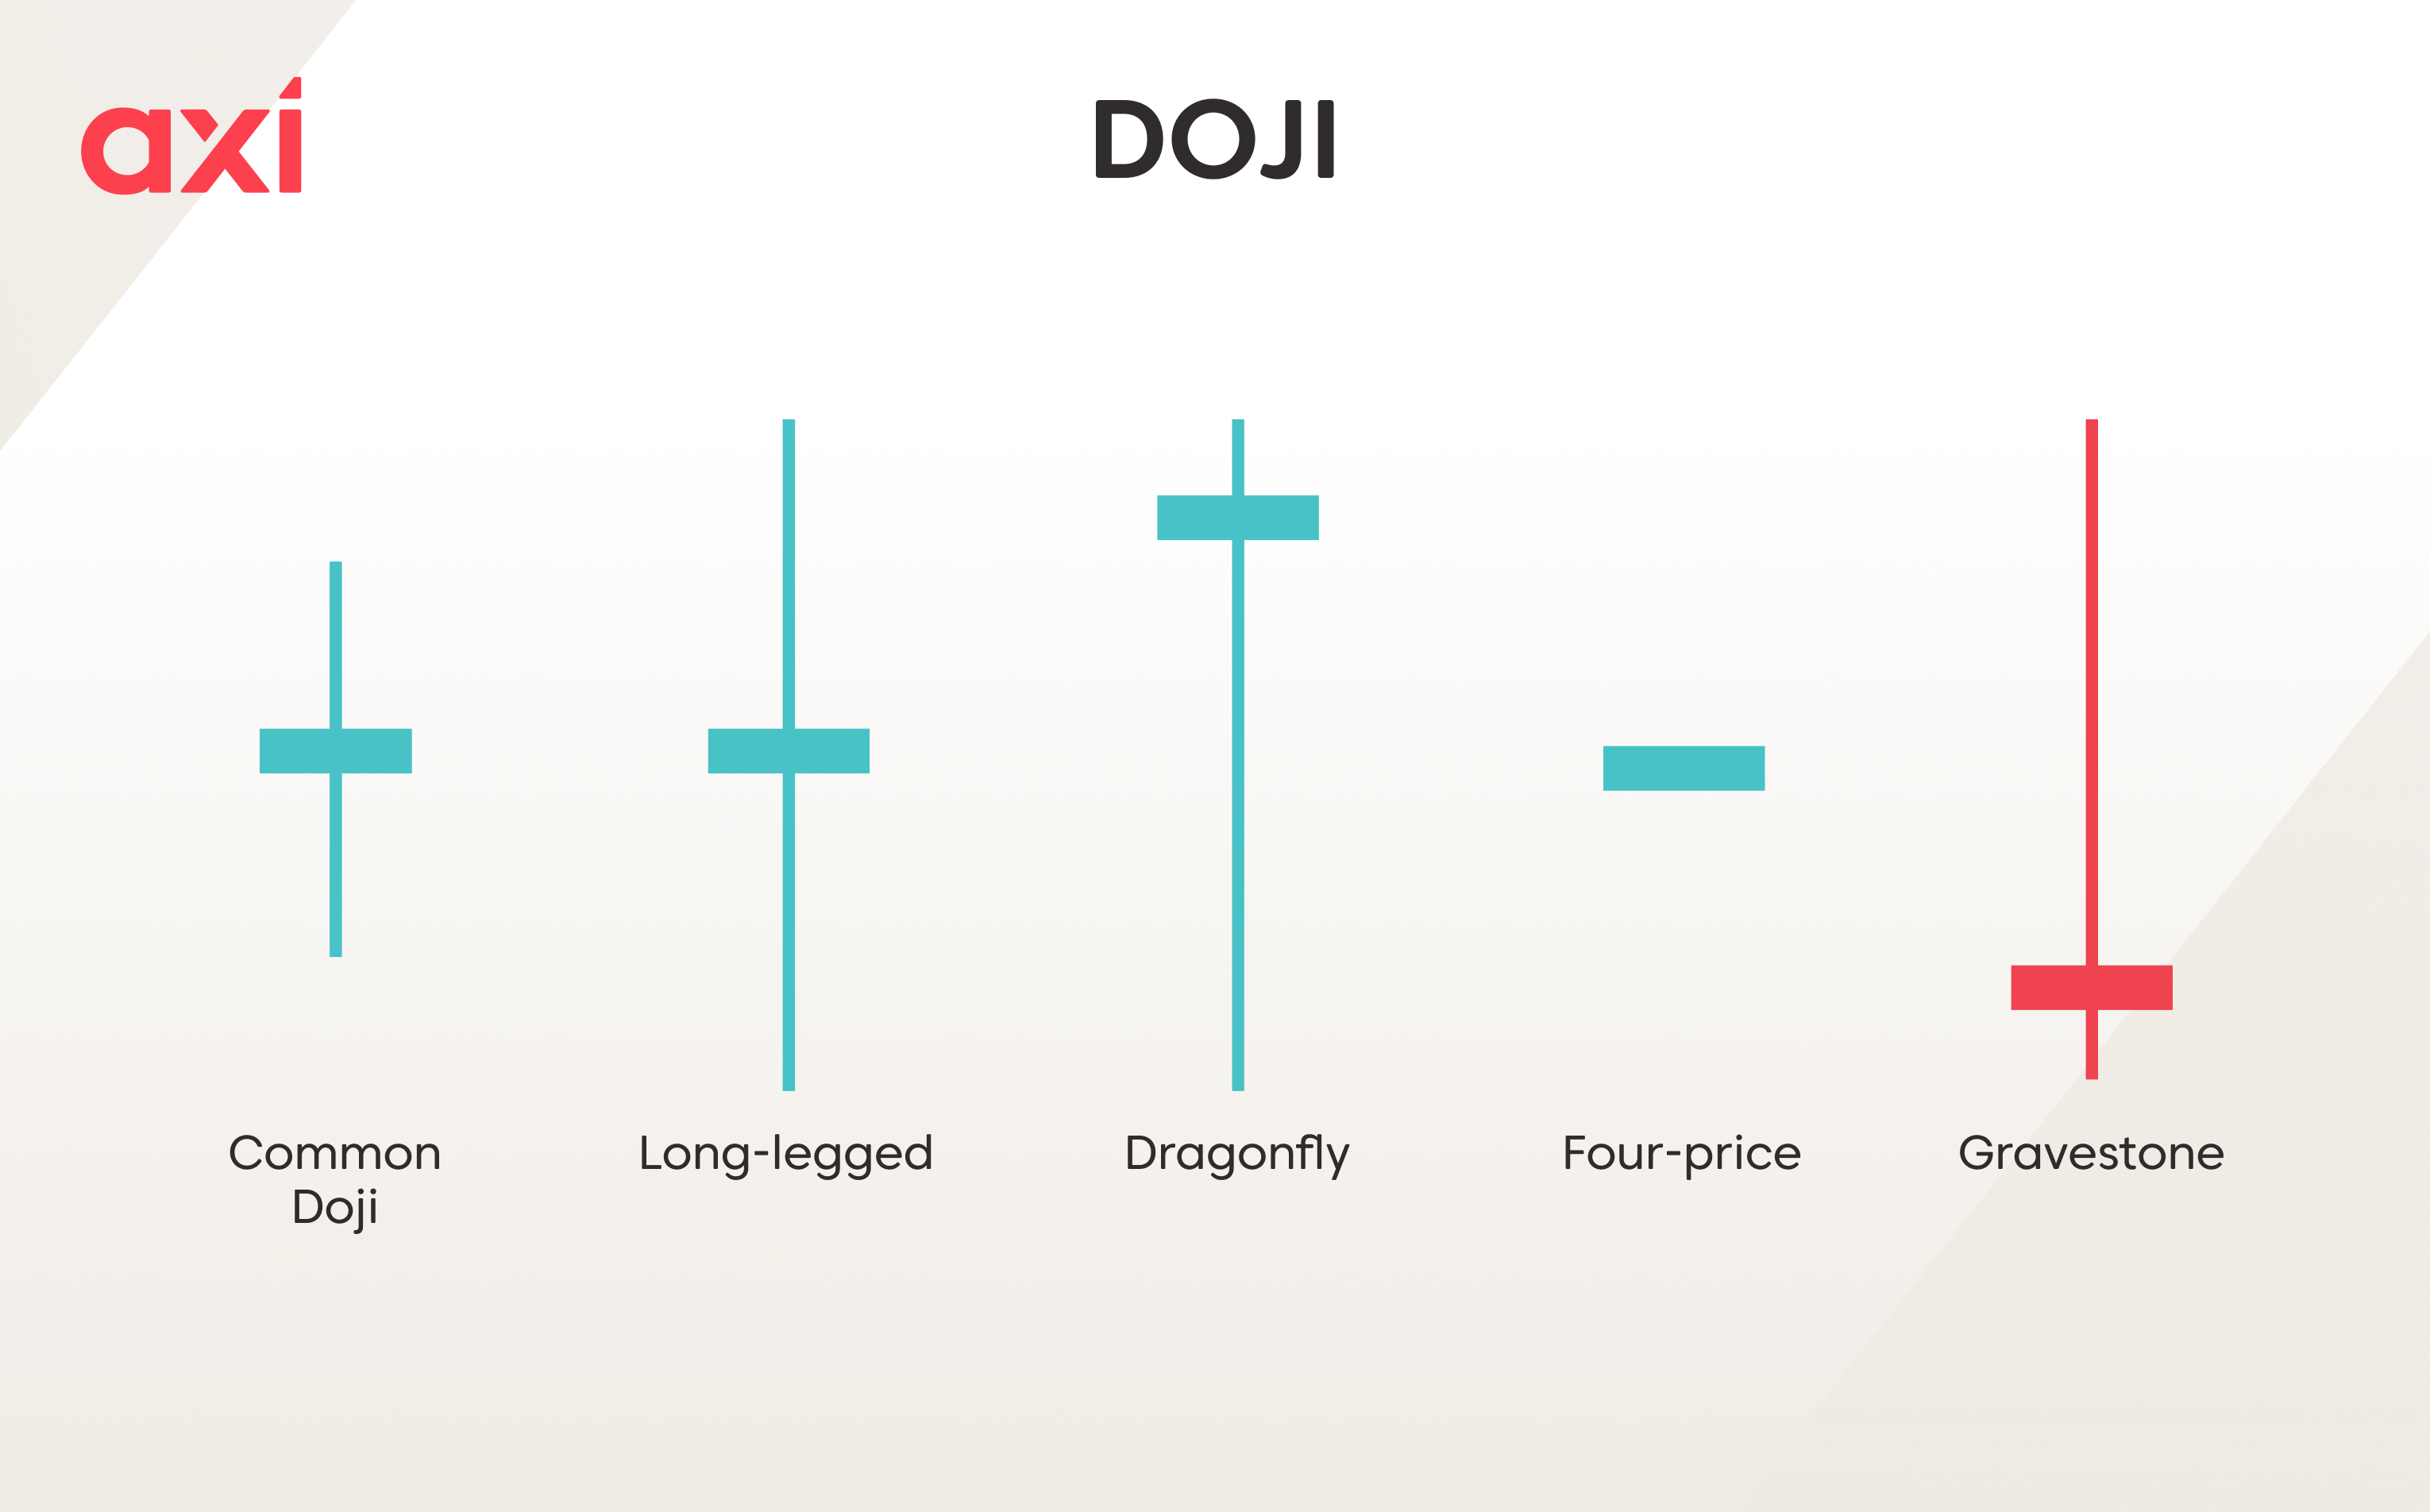
Doji candles generally appear in five forms:
- Classic Doji: The basic variant of the Doji, which is neutral and signals market indecision. The open and close prices are almost the same and the wicks can vary in length.
- Dragonfly Doji: A Doji with a long lower wick and no or almost no upper wick. The open, high and close price are almost the same, indicating that buyers have regained control towards the end of the session. It is considered to be a candlestick pattern that signals a bullish reversal, particularly if it appears during a downtrend and near a significant support level.
- Gravestone Doji: A Doji with a long upper wick but no or almost no lower wick. The open, low and close prices are the same or almost the same. It is the opposite of the dragonfly Doji and typically signals a bearish reversal, particularly if spotted during an uptrend and near a significant resistance level.
- Long-legged Doji: A Doji that looks very similar to the classic Doji in shape, but has long upper and lower wicks, indicating that there has been significant volatility and no clear winner.
- Four-price Doji: This type of Doji has the same open, high, low and close price and no wick or body. It indicates no volatility and basically no movement in the market. We will not see this type of candlestick in liquid markets, at least not during regular trading hours.
Bullish vs. bearish Doji
A Doji candle on its own is neutral, meaning neither bullish nor bearish. What matters is the context, i.e., the prevailing trend and the location where the candle has emerged (for example, a key support or resistance level).
A Doji can be bullish if it forms during a downtrend and near a key support level. It indicates that bears were trying to push the price lower, but failed, leaving no clear winner.
The candle that forms next will be crucial - a strong bullish candle that forms after the Doji would indicate a bullish trend reversal.
On the other hand, a Doji that forms during an uptrend and near a key resistance level would be seen as a bearish reversal if the next candle is a strong bearish candle.
How to identify a Doji candle
Doji candles stand out on a chart due to their distinctive shape. They don’t have a body or almost none, which means the opening and closing prices are identical.
Depending on the type of the Doji, it will appear in the form of a:
- Cross (Classic Doji, long-legged Doji)
- Letter "T" (Dragonfly)
- Inverted letter "T" (Gravestone)
- Single horizontal line (Four-price Doji)
How to trade Doji candles
There are a few steps involved when trading the Doji pattern.
- Establish the current market condition (uptrend, downtrend or consolidation).
- If a Doji is spotted, pay attention to whether it is located near a key support or resistance level.
- Always wait for confirmation before entering the trade.
- You can incorporate technical indicators to help you in the decision-making process.
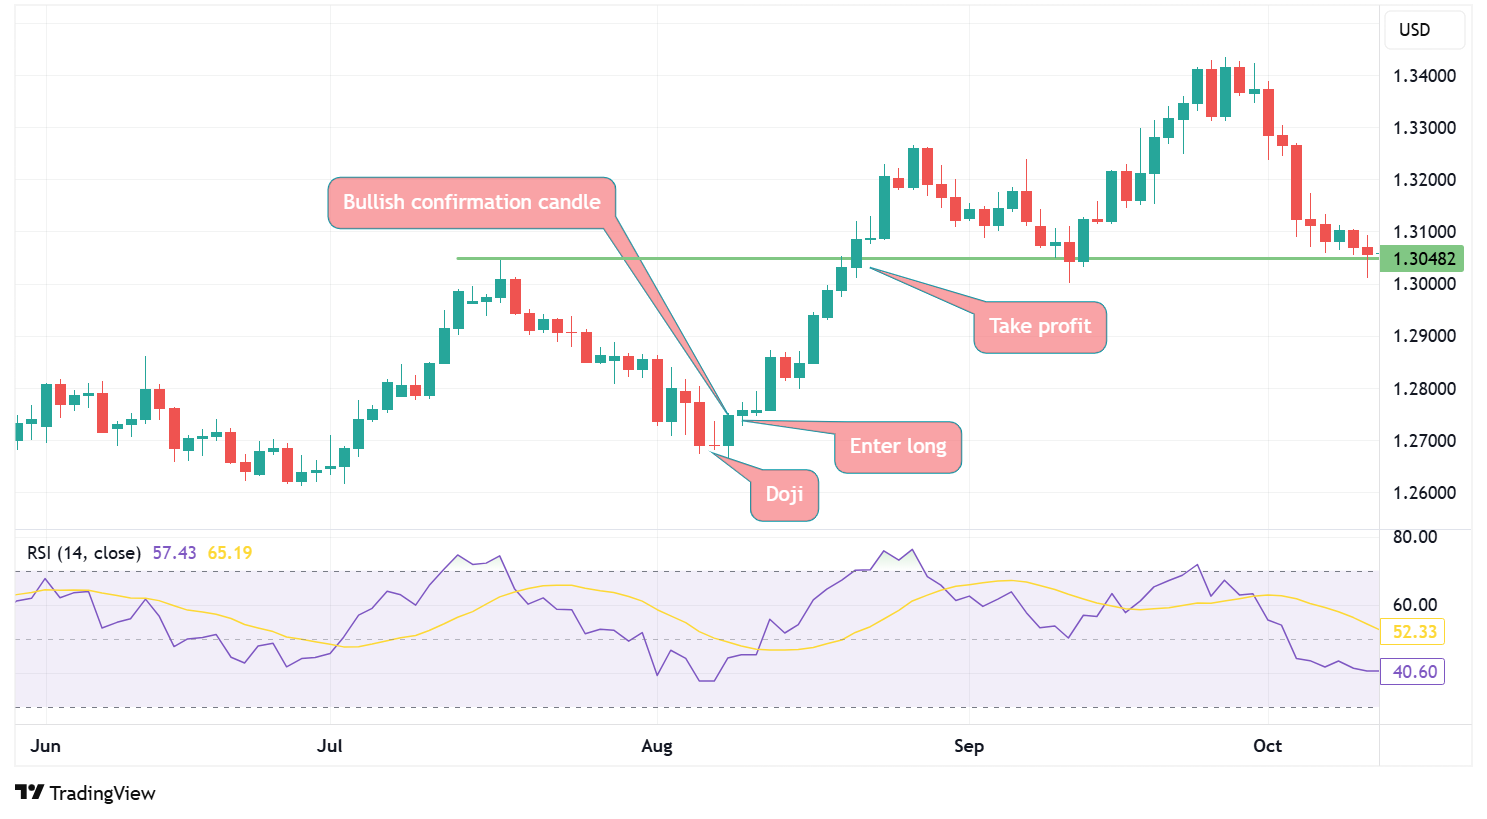
Bullish reversal:
- The instrument is currently in a downtrend.
- A Doji has been spotted near a key support level.
- The candle that forms after the Doji is a strong bullish candle.
- A long position can be entered after the close of the bullish candle that forms after the Doji.
- Traders might set a stop loss below the Doji’s low and aim for take profit at the next resistance level.
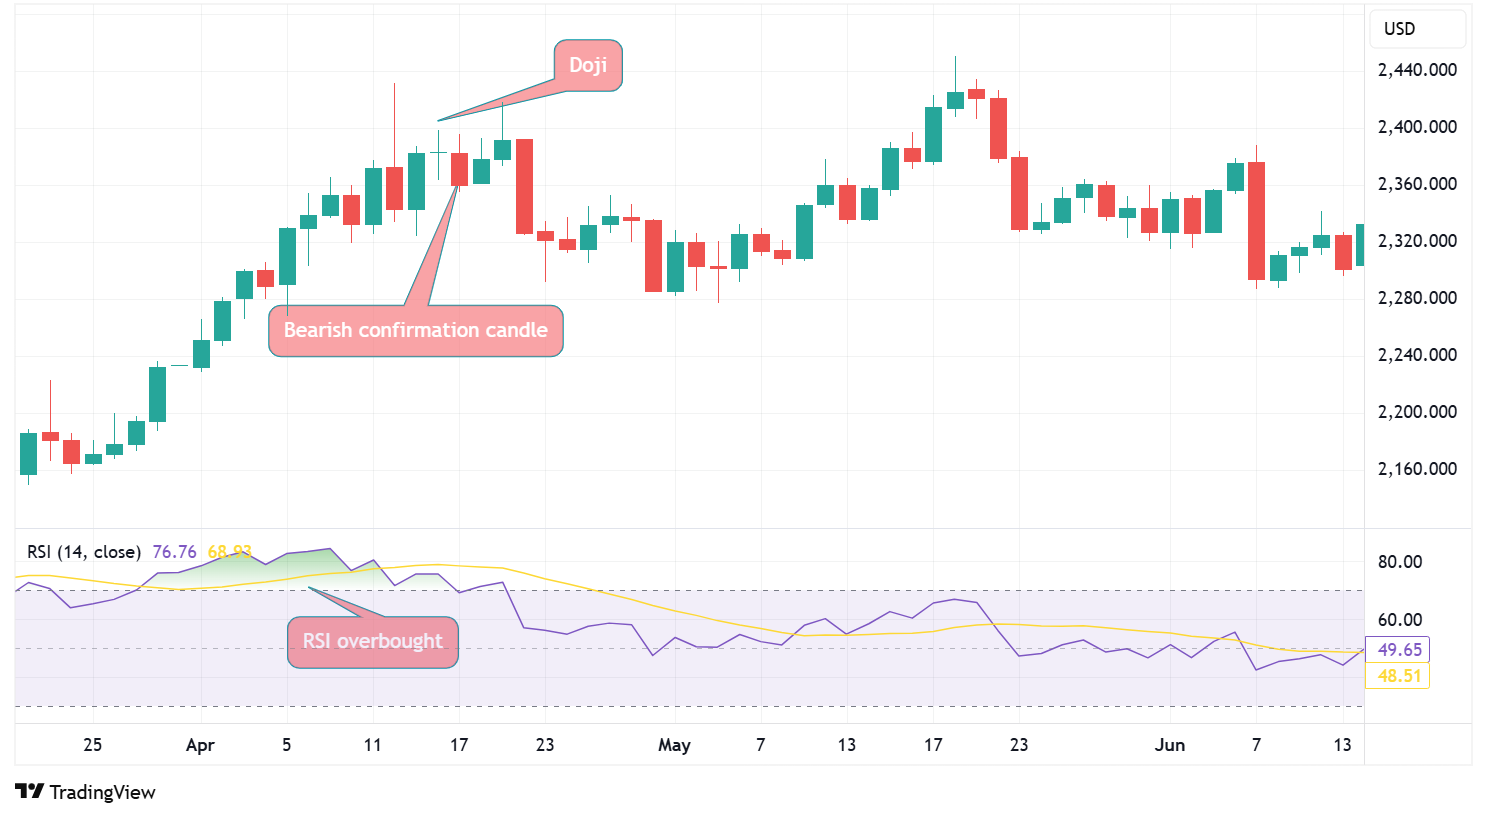
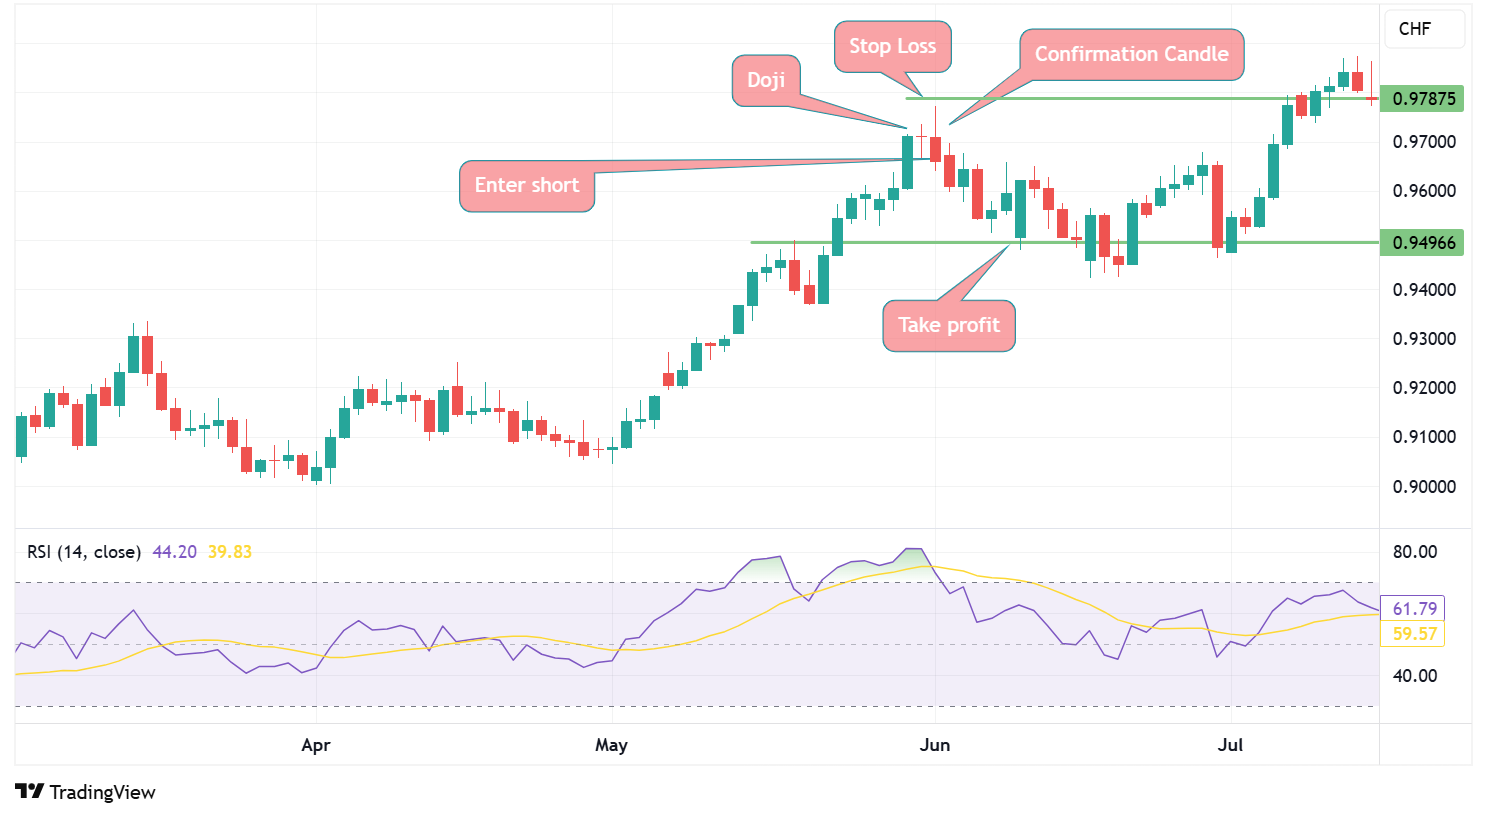
Bearish reversal:
- The instrument is currently in an uptrend.
- Doji spotted near a key resistance level.
- The candle that forms after the Doji is a strong bearish candle.
- A short position can be entered after the close of the bearish candle that forms after the Doji.
- The stop loss order can be placed just above the high of the Doji. The take profit order can be placed at the next significant support level.
Pros and cons of Doji candles
Pros
- Doji candles can help traders spot trend reversals.
- The pattern itself consists of one candlestick and is easy to spot.
- Doji candles are a pattern that can be found across all timeframes and asset classes.
- A trading strategy built around Doji patterns can be both straightforward and follow well-defined rules.
- Strategies involving Doji candles can be combined with other patterns or technical indicators.
Cons
- The Doji itself is a neutral pattern, which means further confirmation is required.
- The Doji can appear frequently, which makes it even more important to wait for confirmation.
- Traders have to keep the bigger picture in mind, as the Doji pattern’s effectiveness will depend on prevailing market conditions.
- As with any candlestick pattern or chart pattern, Doji can generate false signals.
Summary
A Doji is a candlestick that signals market indecision – meaning neither buyers nor sellers are in control. It has a distinctive shape that makes it straightforward to spot on the charts, with its main characteristic being that it has a very small or no body at all due to the opening and closing prices being nearly the same.
There are five types of Doji candles. While three types (classic, long-legged and four-price) are completely neutral, the dragonfly Doji tends to be associated with bullish reversals, while the gravestone Doji tend to be seen as sign of a bearish reversal.
When trading Doji candles, it is important to wait for a confirmation from the next candle, and to understand the current market environment, i.e., whether the instrument is currently in a trend or not.
Ready to trade your edge?
Join thousands of traders and trade CFDs on forex, shares, indices, commodities, and cryptocurrencies!
This information is not to be construed as a recommendation; or an offer to buy or sell; or the solicitation of an offer to buy or sell any security, financial product, or instrument; or to participate in any trading strategy. It has been prepared without taking your objectives, financial situation and needs into account. Any references to past performance and forecasts are not reliable indicators of future results. Axi makes no representation and assumes no liability with regard to the accuracy and completeness of the content in this publication. Readers should seek their own advice.
FAQ
What is a Doji candle?
A candlestick that signals market indecision.
Is a Doji pattern bullish?
No, the Doji pattern itself is neutral.
Is a Doji pattern bearish?
No, the Doji pattern itself is neutral.
Can I trade the Doji pattern without confirmation?
It is not advisable to do so, as the confirmation given by the next candle is important. Doji candles appear frequently, which can increase the chance of a false signal.
Which types of Doji candles exist?
Classic, long-legged, four-price, dragonfly and gravestone Doji candles.
Can the Doji candle be combined with technical indicators?
Yes, combining it with technical indicators can be helpful. For example, if a Doji suggests a bullish reversal and the RSI shows the market is oversold, that’s usually a positive signal.
